Mar 9, 2026/12 min readCore Platform
Why Do We Need Semantic Views? Avoiding Subtle Mistakes in Complex Calculations


In business intelligence (BI), it is very common for vendors such as Snowflake, Tableau, PowerBI and Looker to have a concept of semantic models. They contain the fields that people want to use in order to do an analysis.在商业智能(BI)领域,Snowflake、Tableau、PowerBI 和 Looker 等供应商通常都有语义模型的概念。这些模型包含了人们在进行分析时需要使用的字段。
If you ask BI folks (like myself) about semantic models, you may get some rambling answers with words such as “grain,” “chasm trap” or “fan trap,” as well as a diatribe about ambiguous join paths and role-playing dimensions. This blog post goes through some of these concepts and provides some context on why these are tricky problems and how semantic views give us the tools to solve them. These tools give us the critical safeguards we need to feel confident about our calculations.如果你向 BI 从业者(比如我)询问有关语义模型的问题,你可能会听到一些冗长的回答,其中包含“粒度”(grain)、“深渊陷阱”(chasm trap)或“扇形陷阱”(fan trap)等术语,以及关于歧义连接路径和角色扮演维度(role-playing dimensions)的激烈论述。这篇博客文章将探讨其中一些概念,并提供背景信息,解释为什么这些是棘手的问题,以及语义视图如何为我们提供解决这些问题的工具。这些工具为我们提供了所需的关键保障,让我们能够对自己的计算结果充满信心。
We’ll go through some common analytics pitfalls such as fan and chasm traps and see how they lead to incorrect metrics. We’ll also touch on solutions and discover how addressing the pitfalls with semantic views allows us to focus on the core business questions and not the nuances of query generation.我们将探讨一些常见的分析陷阱,例如扇形陷阱和深渊陷阱,并了解它们如何导致指标错误。我们还将涉及解决方案,并发现通过语义视图解决这些陷阱,能让我们专注于核心业务问题,而不是查询生成的细枝末节。
Joining is hard连接(Joining)很难
This concept is sometimes a little shocking to people. For people who have been joining data for years, it can be hard to understand why it is hard when doing BI or analytics.这个概念有时会让人们感到有些震惊。对于那些多年来一直在进行数据连接的人来说,可能很难理解为什么在做 BI 或分析时这会变得困难。
The pernicious answer to that is “join explosions.” When you join multiple tables, it is common for one of those tables to have its values duplicated. If you then do aggregations on those values, you get the wrong answer. The problem is that SQL is completely happy with the answer. You asked it to join and then to aggregate the results, and that was valid SQL, but it was not valid analytics, because you double counted values.一个有害的答案是“连接爆炸”(join explosions)。当你连接多个表时,其中一个表的值被重复是很常见的。如果你随后对这些值进行聚合,就会得到错误的答案。问题在于,SQL 对这个答案完全没有异议。你要求它进行连接并聚合结果,这在 SQL 语法上是合法的,但在分析上却是无效的,因为你重复计算了数值。
Here is an example of this happening, in a pattern called a fan trap:以下是一个发生这种情况的示例,这种模式被称为扇形陷阱:
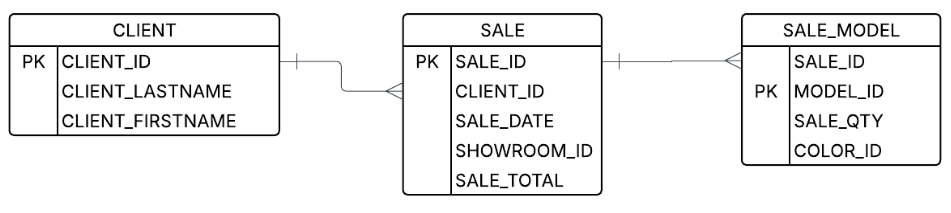
Let’s say a user wants to look at the number of models sold and the total sales price. Well, you know the join keys, and you see the columns — how hard can it be? However, if you do the first join that comes to mind, you will get incorrect results:假设用户想要查看已售模型的数量和总销售价格。嗯,你知道连接键,也能看到列——这能有多难呢?然而,如果你执行脑海中想到的第一个连接,就会得到错误的结果:
That’s because after you do the joins (but before the aggregation), you start with data that looks something like this:这是因为在你执行连接(但在聚合之前)之后,你得到的数据看起来大致如下:
| SALE_ID | CLIENT_ID | SALE_DATE | SHOWROOM_ID | SALE_TOTAL |
|---|---|---|---|---|
| 1234 | abc123 | 10/10/10 | 4 | 100.00 |
| SALE_ID | MODEL_ID | SALE_QTY | COLOR_ID |
|---|---|---|---|
| 1234 | widget-1 | 2 | yellow |
| 1234 | widget-2 | 1 | red |
| 1234 | widget-2 | 1 | blue |
But after the join, the data has a replicated sale_total field and looks like this:但在连接之后,数据中出现了重复的 sale_total 字段,看起来像这样:
| CLIENT_LASTNAME | CLIENT_FIRSTNAME | SALE_TOTAL | SALE_QTY | MODEL_ID |
|---|---|---|---|---|
| Waters | Sam | 100.00 | 2 | widget-1 |
| Waters | Sam | 100.00 | 1 | widget-2 |
| Waters | Sam | 100.00 | 1 | widget-2 |
That, unfortunately, gives you incorrect results. The final aggregation will tell you that Sam Waters spent $300 on four items, when in fact he spent $100 on four items. That’s a big difference!不幸的是,这会导致错误的结果。最终的聚合会告诉你 Sam Waters 在四件商品上花费了 300 美元,而实际上他在四件商品上只花费了 100 美元。这可是巨大的差异!
How to do it right如何正确操作
The right way to do a join like this is to do the aggregation before the join. The core principle we need to follow is aggregating the values separately. There are a few ways to do this, but the canonical way is to create subqueries for the different metrics and combine them for the result.进行此类连接的正确方法是在连接之前先进行聚合。我们需要遵循的核心原则是分别聚合数值。有几种方法可以实现这一点,但最规范的方法是为不同的指标创建子查询,然后将它们组合起来得出结果。
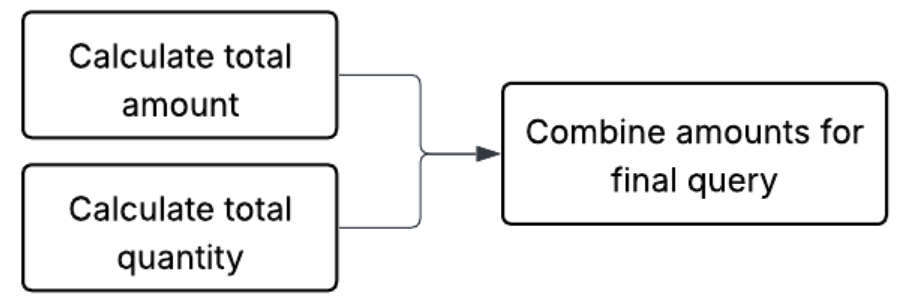
Here is one example of SQL that prevents this case:以下是一个可以防止这种情况的 SQL 示例:
This works because the SALE_MODEL is aggregated before it is joined to SALE, so there is no join explosion. It becomes a one-to-one join.这种方法之所以有效,是因为 SALE_MODEL 在连接到 SALE 之前就已经完成了聚合,因此不会发生连接爆炸。它变成了一个一对一的连接。
Multistep calculations多步计算
You may have noticed above that we needed to break up the query into three different steps. Breaking up calculations into different subqueries is one of the core tricks in de-composing BI queries. In fact, many queries need to get broken up into different steps or different aggregations at different places. These are called multistep calculations.你可能已经注意到,上面我们需要将查询拆分为三个不同的步骤。将计算拆分为不同的子查询是分解 BI 查询的核心技巧之一。事实上,许多查询都需要在不同位置拆分为不同的步骤或不同的聚合。这些被称为多步计算。
Another example of a multistep calculation would be getting a minimum average model price.
In order to do that, we first need to calculate the totals, which involves taking calculations from each table. Then we need to calculate the average, and finally we need to take the minimum. The key concept here is that we need to describe a sequence of calculations in the right order.多步计算的另一个例子是获取最低平均模型价格。为了做到这一点,我们首先需要计算总数,这涉及从每个表中获取计算结果。然后我们需要计算平均值,最后我们需要取最小值。这里的关键概念是,我们需要按正确的顺序描述一系列计算。
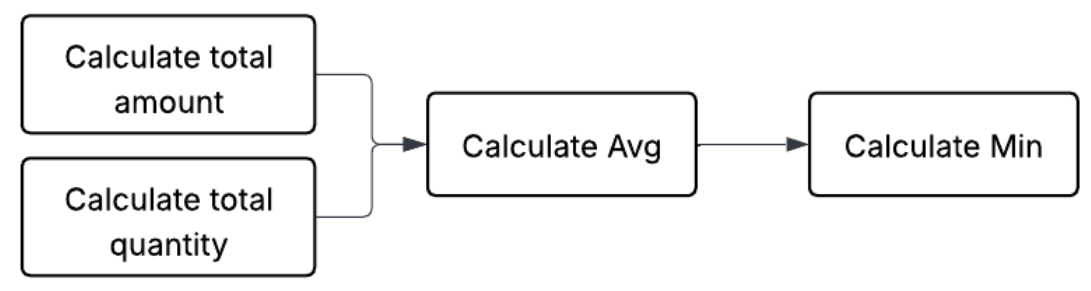
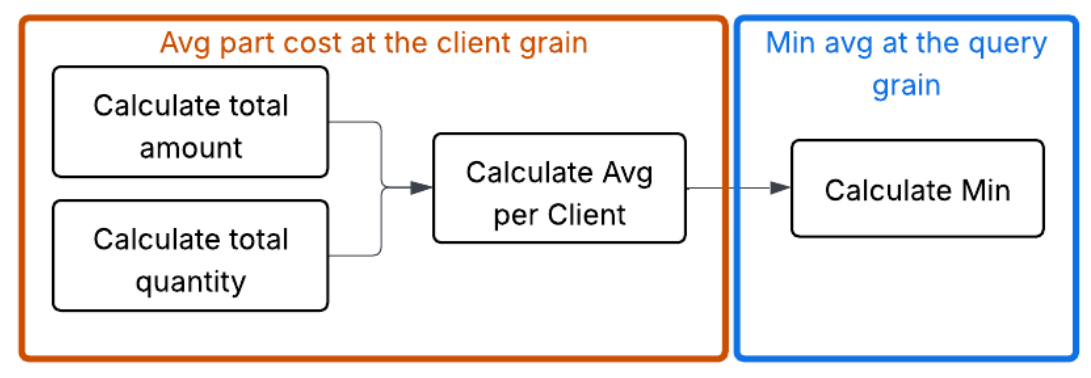
This is a very simple multistep calculation. However, they can get much more complicated depending on how intricate the question is. In order to reason about such multistep calculations, many semantic models employ the concept of “grain,” or “level of detail.”这是一个非常简单的多步计算。然而,根据问题的复杂程度,它们可能会变得复杂得多。为了推导此类多步计算,许多语义模型采用了“粒度”(grain)或“详细程度”(level of detail)的概念。
Grain, or level of detail粒度,或详细程度
Grain is a way to describe part of a multistep calculation or a calculation that has been run to a particular point. In matching it to SQL, this can be thought of as the “group by” used to aggregate. This has a few interesting properties:粒度是一种描述多步计算的一部分,或者描述已经执行到特定阶段的计算的方法。在 SQL 中,这可以被认为是用于聚合的“group by”。它具有一些有趣的属性:
- It is a useful way to mark a spot in a multistep aggregation. Even in complex calculations, it turns out that denoting a level of detail as an aggregation goal is useful.它是标记多步聚合中某个点的有效方法。即使在复杂的计算中,将详细程度定义为聚合目标也是有用的。
- At a particular grain, it is guaranteed that the field in the grain will uniquely define a row. This is useful for combining calculations.在特定的粒度下,可以保证该粒度中的字段将唯一地定义一行。这对于组合计算非常有用。
Using grain to address the chasm trap使用粒度来解决深渊陷阱
In addition to the fan trap shown above, there is also a chasm trap. In dimensional modeling environments such as snowflake or star schemas, this will often be called a “shared dimension.” This is because it connects two different fact tables that are not naturally connected.除了上面提到的扇形陷阱外,还有一种深渊陷阱。在 Snowflake 或星型模式等维度建模环境中,这通常被称为“共享维度”。这是因为它连接了两个本质上并不直接关联的不同事实表。
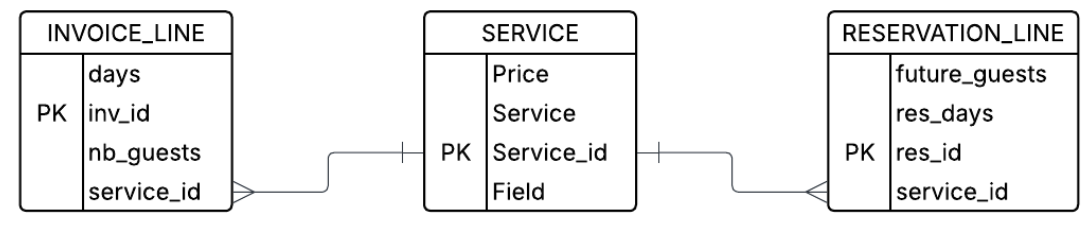
Imagine a case in which a manager wants to issue a query looking at both the NB_GUESTS that have already used a service and the FUTURE_GUESTS that have gotten a reservation. They issue a query with:设想这样一种情况:经理想要发布一个查询,同时查看已经使用过服务的 NB_GUESTS 和已经预订的 FUTURE_GUESTS。他们发出了一个如下的查询:
This straightforward query will unfortunately cause rows to explode. It will create the combinatorics of invoice and reservations for each service_id. To see why this is, imagine that the INVOICE_LINE and RESERVATION_LINE have the following data:不幸的是,这个直接的查询会导致行数爆炸。它会为每个 service_id 创建发票和预订的组合。要了解原因,想象一下 INVOICE_LINE 和 RESERVATION_LINE 具有以下数据:
INVOICE_LINEINVOICE_LINE
| INV_ID | SERVICE_ID | NB_GUESTS |
|---|---|---|
| I-99 | S1 | 2 |
| I-100 | S1 | 3 |
RESERVATION_LINERESERVATION_LINE
| RES_ID | SERVICE_ID | FUTURE_GUESTS |
|---|---|---|
| R-501 | S1 | 4 |
| R-502 | S1 | 1 |
The join will then yield the following intermediate table, which duplicated the column.连接将产生以下中间表,该表重复了列。
| SERVICE | INV_ID | NB_GUESTS | RES_ID | FUTURE_GUESTS |
|---|---|---|---|---|
| Guided Tour | I-99 | 2 | R-501 | 4 |
| Guided Tour | I-99 | 2 | R-502 | 1 |
| Guided Tour | I-100 | 3 | R-501 | 4 |
| Guided Tour | I-100 | 3 | R-502 | 1 |
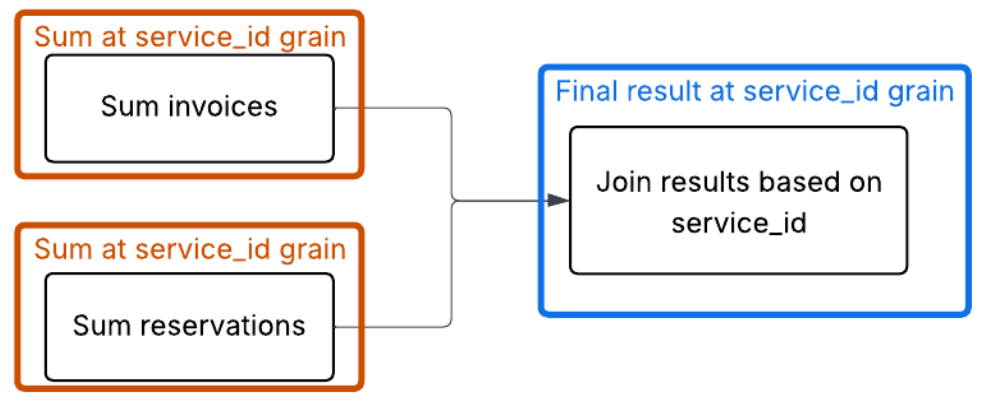
The correct way to handle this is to aggregate both the INVOICE_LINE and the RESERVATION_LINE to the grain of service_id before joining, so that each side has only one row for each service_id.处理此问题的正确方法是在连接之前将 INVOICE_LINE 和 RESERVATION_LINE 都聚合到 service_id 的粒度,以便每一侧对于每个 service_id 只有一行。
Splitting up aggregations (average of averages is bad)拆分聚合(平均值的平均值是错误的)
Now that we have wrapped our head around how aggregations may get split up, let’s look at some mistakes that can happen, even if queries are staged properly. Not all aggregation functions can be broken up so easily.现在我们已经了解了聚合是如何被拆分的,让我们来看看即使查询分阶段得当也可能发生的一些错误。并非所有的聚合函数都能如此轻易地拆分。
Average is a good example here. Taking an average of an average tends not to be a good idea. This is because the second average is unweighted, meaning it treats groups of vastly different sizes (such as a service with 100 invoices versus a service with one) as being equally important to the final result.平均值就是一个很好的例子。取平均值的平均值通常不是一个好主意。这是因为第二次平均是未加权的,这意味着它将规模差异巨大的组(例如拥有 100 张发票的服务与只有 1 张发票的服务)视为对最终结果同样重要。
Look at the following data:看看以下数据:
| INV_ID | SERVICE_ID | NB_GUESTS |
|---|---|---|
| I-001 | S1 | 2 |
| I-002 | S1 | 2 |
| I-003 | S1 | 2 |
| I-004 | S1 | 2 |
| I-005 | S1 | 2 |
| I-006 | S1 | 2 |
| I-007 | S1 | 2 |
| I-008 | S1 | 2 |
| I-009 | S1 | 2 |
| I-999 | S2 | 30 |
Step 1A (the incorrect way): Calculate averages per service (the "subaggregations")步骤 1A(错误的方法):计算每个服务的平均值(“子聚合”)
- Service S1 average: 18 total guests / 9 invoices = 2.0 guests/inv服务 S1 平均值:18 位总客人 / 9 张发票 = 2.0 位客人/发票
- Service S2 average: 30 total guests / 1 invoice = 30.0 guests/inv服务 S2 平均值:30 位总客人 / 1 张发票 = 30.0 位客人/发票
Step 1B (the incorrect way): The "average of averages"步骤 1B(错误的方法):“平均值的平均值”
(2.0 + 30.0) / 2 = 16.0(2.0 + 30.0) / 2 = 16.0
The "true average" (the correct way)“真实平均值”(正确的方法)
To get the true average across all business operations, you must sum all guests and divide by all invoices:要获得所有业务运营的真实平均值,必须将所有客人相加并除以所有发票数:
(18 + 30) / (9 + 1) = 48 / 10 = 4.8(18 + 30) / (9 + 1) = 48 / 10 = 4.8
A semantic model doesn't just store data; it stores the logic (sum / count). This prevents the “average of averages” error by ensuring that the math is always performed on raw unaggregated rows, even when filtered.语义模型不仅存储数据,还存储逻辑(求和 / 计数)。这确保了数学运算始终在原始的未聚合行上执行(即使在过滤后),从而避免了“平均值的平均值”错误。
The cost of the "SQL tax"“SQL 税”的代价
The examples above — the fan trap, the chasm trap and the fallacy of averages — share a common thread: SQL is a literal language, but business logic is contextual. When we rely on "raw" SQL joins to answer complex questions, we are effectively paying a "SQL tax" every time we build a report. This tax comes in three forms:上述示例——扇形陷阱、深渊陷阱和平均值谬误——有一个共同点:SQL 是一种字面语言,但业务逻辑是有上下文的。当我们依赖“原始”SQL 连接来回答复杂问题时,我们实际上是在每次构建报表时都要支付“SQL 税”。这种税有三种形式:
- The fragility of manual labor: Writing 50-line CTEs to avoid a fan trap works once. But what happens when a new join is added? Or a filter? The logic is brittle, and the moment it breaks, the data becomes a lie.人工劳动极其脆弱:编写 50 行的 CTE 来避免扇形陷阱一次是有效的。但如果增加了一个新的连接呢?或者一个过滤器呢?逻辑非常脆弱,一旦它崩溃,数据就变成了谎言。
- The "CEO question" test: If two different analysts are asked for "average revenue per service" and one uses a flat join while the other uses a CTE, they will provide two different answers. In that moment, the credibility of the entire BI department evaporates.“CEO 问题”测试:如果要求两名不同的分析师计算“每个服务的平均收入”,其中一人使用扁平连接,而另一人使用 CTE,他们将提供两个不同的答案。在那一刻,整个 BI 部门的信誉将荡然无存。
- Analyst burnout: Your best data minds should be finding insights (for example, "Why is our guided tour revenue dipping?"), not playing "data janitor" by manually auditing joins to make sure a column hasn't exploded by a factor of 10.分析师倦怠:你最优秀的数据人才应该致力于寻找洞察力(例如,“为什么我们的导览收入在下降?”),而不是通过手动审计连接来扮演“数据清洁工”,以确保某个列没有发生 10 倍的爆炸式增长。
Semantic views solve this problem by building analytical safety into the query itself. When you run a query on a semantic view, it will not fall into any of the traps described in this document. Avoiding them is built into the fabric of how they run.语义视图通过将分析安全性构建到查询本身来解决这个问题。当你对语义视图运行查询时,它不会陷入本文描述的任何陷阱中。避免这些陷阱是其运行机制的核心部分。
From choosing queries to choosing columns从选择查询到选择列
After you establish a semantic view, your problem becomes simpler. Rather than choosing how to create a query, you choose what dimensions and metrics you want, and the semantic SQL does the rest. Furthermore, you have options. You can either use semantic SQL to have a semantic native interface or use standard SQL and pretend the semantic view is one flat table. You choose the columns; we do the rest.建立语义视图后,你的问题就变得简单了。你不再需要选择如何创建查询,而是选择你想要的维度和指标,剩下的工作由语义 SQL 完成。此外,你还有多种选择。你可以使用语义 SQL 来获得语义原生接口,或者使用标准 SQL 并假装语义视图是一个扁平表。你选择列,我们完成其余的工作。
Here is an example of the fan trap being solved this way. The semantic view locks in how calculations can be done, ensuring that clients (whether human or LLM) will avoid the many possible traps and mistakes.这是一个以这种方式解决扇形陷阱的示例。语义视图锁定了计算方式,确保客户端(无论是人类还是大语言模型)都能避免许多可能的陷阱和错误。
Create a semantic view using your correct formulations. Create tables to pull in the data you need. Create relationships to define the acceptable join paths. Create dimensions and metrics to expose how to support slicing, dicing and analyzing your data. In particular, metrics can be a critical way to ensure users are calculating important concepts such as revenue in the same, approved way.使用正确的公式创建语义视图。创建表以获取所需数据。创建关系以定义可接受的连接路径。创建维度和指标以展示如何支持数据的切片、切块和分析。特别是,指标是确保用户以相同、批准的方式计算收入等重要概念的关键途径。
The resulting queries are structurally validated. By decoupling the query intent from the join logic, the semantic view ensures the results remain free from traps, regardless of complexity.由此产生的查询在结构上经过了验证。通过将查询意图与连接逻辑解耦,语义视图确保结果无论多么复杂,都能保持无陷阱。
Standard SQL uses the semantic view as a table:标准 SQL 将语义视图用作表:
Semantic SQL directly uses the SEMANTIC_VIEW table function:语义 SQL 直接使用 SEMANTIC_VIEW 表函数:
From data sprawl to a single source of truth从数据蔓延到单一事实来源
A semantic view isn't just a technical layer; it’s an insurance policy for your data’s integrity. By defining the "grains" and "relationships" once, the model handles the "agg-before-join" logic automatically.语义视图不仅仅是一个技术层,它还是数据完整性的保险单。通过一次性定义“粒度”和“关系”,模型会自动处理“先聚合后连接”的逻辑。
In a world of data on a Snowflake scale and amazing frontier models, the bottleneck is no longer based on how fast we can query; rather, it's how accurately we can define what we are querying. We don't need more dashboards — we need a unified language that ensures the math is right, no matter who is asking the question.在 Snowflake 规模的数据和令人惊叹的前沿模型世界中,瓶颈不再在于我们查询的速度,而在于我们定义查询内容的准确性。我们不需要更多的仪表板,我们需要一种统一的语言,确保无论谁提出问题,数学计算都是正确的。
Snowflake semantic views allow you to build your business and analytics logic into the database to enable safer and smarter analytics. Semantic views are a governed way to define important business metrics. Whether you query them directly from SQL or use an agent to query them, they provide the critical context that is needed by either LLMs or SQL query generation.Snowflake 语义视图允许你将业务和分析逻辑构建到数据库中,以实现更安全、更智能的分析。语义视图是一种定义重要业务指标的受控方式。无论你是直接通过 SQL 查询它们,还是使用代理来查询它们,它们都提供了大语言模型或 SQL 查询生成所需的关键上下文。
Appendix: Can’t LLMs do all of this?附录:大语言模型不能完成所有这些工作吗?
Frontier models are amazing and are getting better at an incredible pace. However, at this point they seem to still be susceptible to the types of problems described above. One of the issues with finding these problems is that they can get very complicated fast.前沿模型非常出色,并且正在以惊人的速度进步。然而,目前它们似乎仍然容易受到上述问题的影响。发现这些问题的一个难点在于它们很快就会变得非常复杂。
With a small number of tables, LLMs do a great job. However, I’ve still encountered the traps and averages of averages. Below, I’ve included an example I’ve seen in our evals — see if you can find the error.在表数量较少的情况下,大语言模型表现出色。然而,我仍然遇到过陷阱和平均值的平均值问题。我在下面包含了一个我在评估中看到的示例——看看你是否能找到其中的错误。
It turns out that the same concepts around semantic models that help humans get complicated queries right can also help LLMs.事实证明,帮助人类正确处理复杂查询的语义模型概念,同样可以帮助大语言模型。
At Snowflake, we have developed semantic views to codify the core calculations and relationships required for high-precision analytics. Querying these views directly ensures deterministic results, while Snowflake Intelligence and agents use them as a grounded framework to generate more accurate SQL.在 Snowflake,我们开发了语义视图来编码高精度分析所需的核心计算和关系。直接查询这些视图可确保结果具有确定性,而 Snowflake Intelligence 和代理则将其用作生成更准确 SQL 的基础框架。
LLM generated code with a flaw大语言模型生成的带有缺陷的代码
The following SQL is an example of a query generated by a very capable LLM over the TPC-DS data set. This query falls into one of the analytical traps mentioned above. Can you tell which one it is? Can you think of the right way to run this query instead?以下 SQL 是一个非常强大的大语言模型针对 TPC-DS 数据集生成的查询示例。此查询陷入了上述提到的分析陷阱之一。你能看出是哪一个吗?你能想到运行此查询的正确方法吗?
The issue this query falls into is the fan trap. The first CTE tried starting with the customer table and joining through all of the fact tables and dimensions. The problem is that this can cause a join explosion, which would give the wrong aggregation for total_sales.此查询陷入的问题是扇形陷阱。第一个 CTE 尝试从客户表开始,并连接所有事实表和维度。问题在于,这可能导致连接爆炸,从而导致 total_sales 的聚合结果错误。
Example code示例代码
If you want to play around at home, here is a snippet of code that should create minimal tables and data so you can see the fan trap in action and how semantic views solve the problem.如果你想在本地尝试,这里有一段代码片段,它应该能创建最少的表和数据,让你亲眼看到扇形陷阱的实际情况,以及语义视图如何解决这个问题。