Data analysis skills are becoming increasingly important as organizations rely on data to make faster and smarter decisions. With the help of AI, many data tasks, such as cleaning datasets, identifying trends, and generating insights, can now be completed more efficiently. AI skills provide reusable workflows and methodologies that help agents perform these analysis tasks in a more structured way. This guide explores 22 data analysis skills that can streamline data workflows and turn raw data into actionable insights.随着各组织愈发依赖数据来做出更迅速、更明智的决策,数据分析技能正变得日益重要。在人工智能的帮助下,清理数据集、识别趋势和生成见解等许多数据任务现在可以更高效地完成。AI 技能提供了可复用的工作流和方法论,有助于智能体以更结构化的方式执行这些分析任务。本指南探讨了 22 种可以简化数据工作流并将原始数据转化为可操作见解的数据分析技能。
What are AI data analysis skills?什么是 AI 数据分析技能?
Data analysis skills provide AI agents with structured instructions, workflows, and guidelines to handle fundamental data analysis tasks. They help agents organize data, clean datasets, identify patterns, generate charts, perform basic calculations, and summarize insights from raw information.数据分析技能为 AI 智能体提供了处理基础数据分析任务的结构化指令、工作流和指导原则。它们能帮助智能体组织数据、清理数据集、识别模式、生成图表、执行基本计算以及从原始信息中总结见解。
Kimi AI data management and analysis skillsKimi AI 数据管理与分析技能
Kimi offers a wide range of AI skills in the Skills store that simplify data processing, analysis, and reporting. Whether you're cleaning datasets, creating visualizations, or generating insights, these tools help automate repetitive tasks and improve efficiency. Here are 12 AI data management and analysis skills you can explore in the Kimi Skills store.Kimi 在技能商店中提供了广泛的 AI 技能,可简化数据处理、分析和报告流程。无论您是在清理数据集、创建可视化图表还是生成见解,这些工具都能帮助您自动化重复性任务并提高效率。以下是您可以在 Kimi 技能商店中探索的 12 种 AI 数据管理与分析技能。
| Skill name | Description |
|---|---|
| sql-insight | Translate natural language to SQL, optimize query performance, and interpret EXPLAIN plans for SQLite and PostgreSQL. Triggered when users ask to convert questions into SQL, improve slow queries, tune indexes, analyze execution plans, or mention keywords like NL2SQL, query tuning, or full table scan. |
| auto-hypothesis-test | Automatically selects and runs the right statistical test for your data — the ANOVA, chi-square, Mann-Whitney, or others, and provides plain-language interpretations of the results. Triggered when you ask about group comparisons, significance, p-values, hypothesis testing, or mention specific tests like t-test, ANOVA, or chi-square. |
| correlation-auditor | Analyzes correlation matrices (Pearson/Spearman), computes partial correlations to control confounding variables, and flags potential spurious correlations in your data. Triggered when users ask about relationships between variables, need correlation matrices, or mention Pearson/Spearman coefficients, partial correlation, confounding factors, or spurious correlations. |
| data-viz-renderer | Generate self-contained HTML/SVG infographics from JSON data, including stat cards, bar charts, flow diagrams, and mixed dashboards. Offers 8 color palettes and built-in icons with no external dependencies. Triggered when users request data visualization, infographics, charts, or dashboards. |
| dataset-quality-audit | Run comprehensive quality checks on tabular data (CSV/Excel/TSV/JSON), detecting missing values, duplicates, outliers, format issues, and type inconsistencies to produce an overall score, grade, and actionable suggestions. Triggered when users ask to check data quality, find missing or duplicate values, detect outliers, validate formats, profile data, or clean data. |
| discounted-cashflow-model | Builds a discounted cash flow (DCF) valuation model, calculating enterprise value, equity value, and per-share price with a growth-rate × discount-rate sensitivity analysis matrix. Triggered by requests like 'do a DCF on \[company]', 'run a valuation', 'calculate WACC/discount rate', or mentions of free cash flow, terminal value, or sensitivity analysis. |
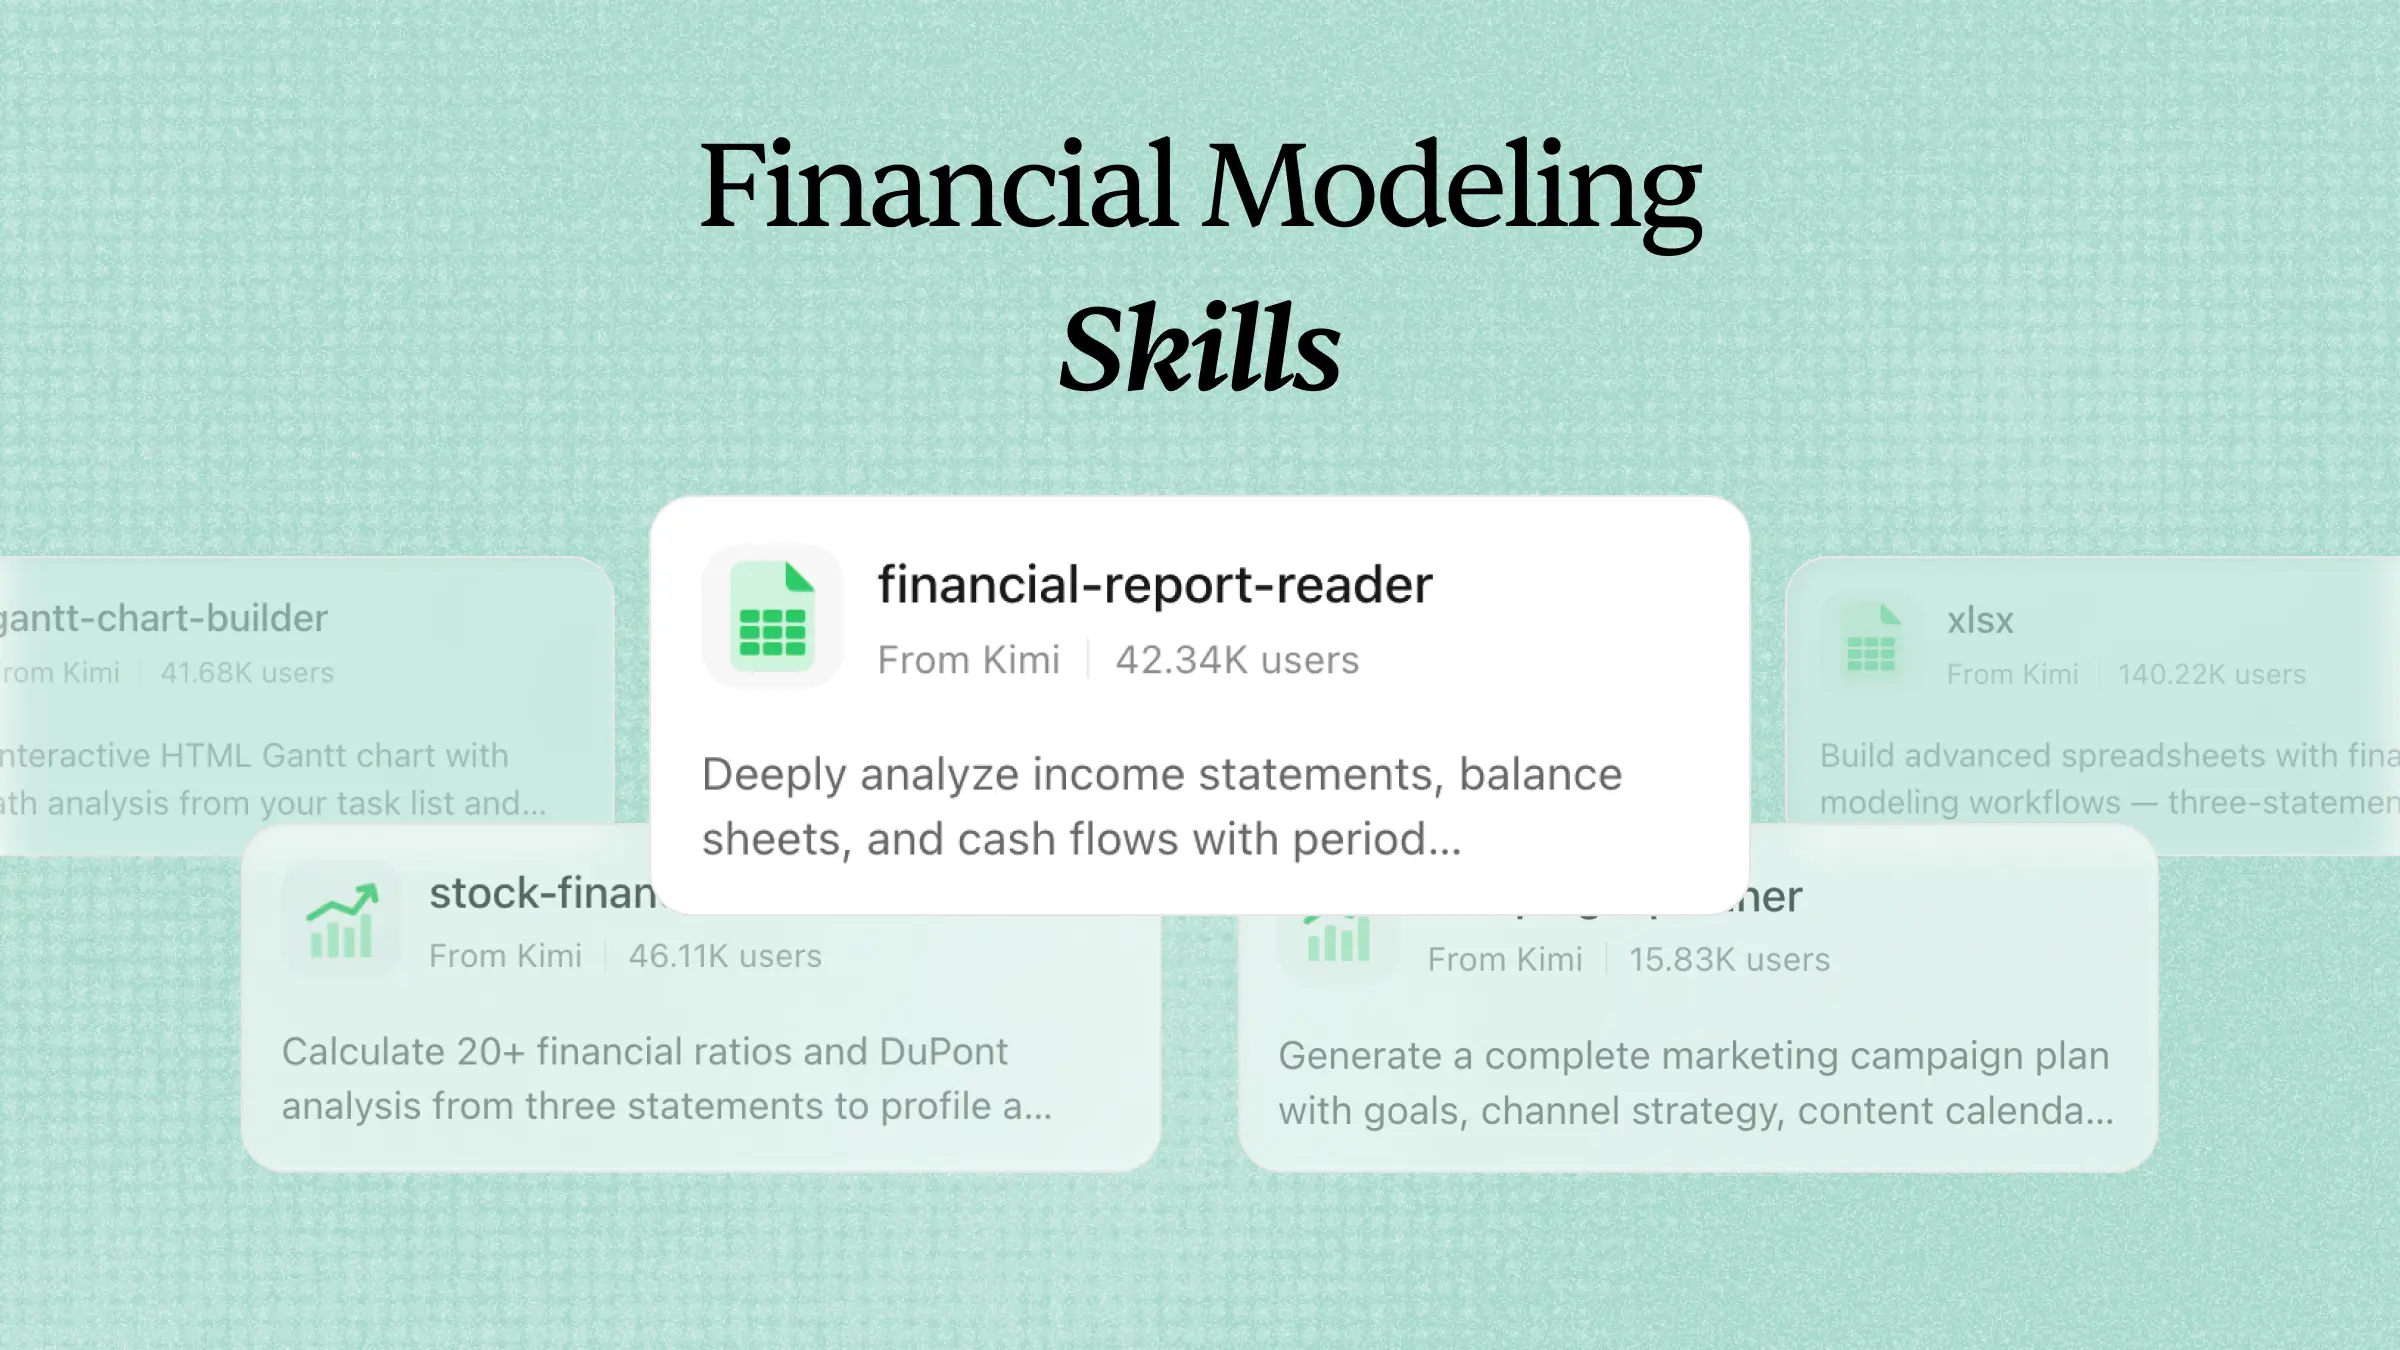
| financial-ratio-toolkit | Analyzes company fundamentals by computing 20+ financial ratios (profitability, solvency, liquidity, efficiency, and growth) and the DuPont Analysis from user-provided financial statements. Triggered by requests for financial ratio calculation, DuPont/ROE analysis, or phrases like "analyze these financials" or "calculate solvency ratios. |
| financial-statement-analyzer | Analyzes income statement, balance sheet, and cash flow statement data to generate YoY/QoQ trend analysis and flag anomalies like AR surges or cash flow divergence. Trigger when users ask to analyze financials, compare YoY/QoQ, detect red flags, or assess earnings quality. |
| regression-modeler | Run regression analysis (OLS or logistic) on uploaded CSV/Excel data, generating coefficients, R², p-values, VIF, and plain-language interpretation. Triggered by requests for regression modeling, fitting data, testing significance, checking multicollinearity, or keywords like OLS, logit, coefficient, p-value, or R-squared. |
| stock-research-report | Generate securities research reports in Guotai Haitong / Haitong International style. Use for Chinese equity research, industry tracking, investment notes, and financial research documents. Triggers on keywords: Guotai Haitong, Haitong International, industry tracking, stock research, securities research. Supports domestic and international dual templates. |
| stock-signal-analyzer | Analyzes OHLCV data to compute 15+ technical indicators (including MA, MACD, RSI, Bollinger Bands, KDJ) and generates a bullish/bearish signal summary with an overall assessment. Triggered when users request technical analysis, ask to calculate indicators like MACD or RSI, mention candlestick analysis, or discuss signals from moving average crossovers, Bollinger Band breakouts, or RSI overbought/oversold levels. |
| value-investing-scorecard | Buffett/Graham's value investing scorecard — evaluates a company across 20 criteria in four dimensions (moat, management, financials, valuation) for a 0-100 score. Triggered when users request a value-investing analysis, fundamental scoring, moat assessment, or ask 'is this company worth investing in', 'analyze the fundamentals of XX', or 'evaluate this using Buffett's method'. |
| weighted-scorer | Builds weighted scoring decision matrices for technology selection, vendor evaluation, and multi-criteria option comparisons. Guides you through defining criteria, assigning weights, scoring options, and validating results with sensitivity analysis. Trigger when users ask about decision matrices, weighted scoring, comparing options, vendor selection, or build vs. buy choices. |
| chart-image | Generate publication-quality PNG chart images from data, supporting line, bar, area, candlestick, pie, and heatmap charts. Triggers when the user asks to visualize data, create a graph, plot a time series, or generate a chart for a report, alert, or dashboard. Runs as a lightweight, headless Node.js process without a browser. |
| xlsx | Specialized utility for advanced manipulation, analysis, and creation of spreadsheet files, including (but not limited to) XLSX, XLSM, and CSV formats. Core functionalities include formula deployment, complex formatting (including automatic currency formatting for financial tasks), data visualization, mandatory post-processing recalculation, and finance-focused Excel modeling workflows such as three-statement models, DCF valuation, and public comps analysis. |
Use Kimi AI data analysis skills使用 Kimi AI 数据分析技能
Follow these simple steps to use Kimi AI skills for faster data analysis, financial calculations, and automated reporting.请按照以下简单步骤使用 Kimi AI 技能,以实现更快速的数据分析、财务计算和自动化报告。
Step 1: Install the skill and input its command第 1 步:安装技能并输入其命令
Open Kimi and type / in the input box to open the Skills store. Search for financial-ratio-toolkit and click to install it. Then type /financial-ratio-toolkit in the input box to activate the skill.打开 Kimi,在输入框中输入 / 以打开技能商店。搜索 financial-ratio-toolkit 并点击安装。然后,在输入框中输入 /financial-ratio-toolkit 以激活该技能。
Step 2: Start your research task第 2 步:开始您的研究任务
Describe the dataset or financial analysis you want Kimi to perform after activating the skill.激活技能后,描述您希望 Kimi 执行的数据集或财务分析。
Example prompt:提示词示例:
Then Kimi automatically analyzes the data, performs the required calculations, and generates a structured report with key insights to support faster decision-making.之后,Kimi 会自动分析数据、执行所需的计算,并生成一份包含关键见解的结构化报告,以支持更快速的决策。
Step 3: Review and download your document第 3 步:查看并下载您的文档
Review the generated report, make any necessary edits, and download the final document for further analysis, sharing, or presentation.查看生成的报告,进行必要的编辑,并下载最终文档以供进一步分析、分享或演示。
Unlock 6 more open-source data analysis skills解锁另外 6 种开源数据分析技能
Open-source skills provide AI agents with specialized workflows for different data analysis tasks. By installing these skills in Kimi, you can automate data processing, perform deeper analysis, and build more efficient workflows for handling complex datasets. Here are 6 open-source data analysis skills worth exploring.开源技能为 AI 智能体提供了针对不同数据分析任务的专业工作流。通过在 Kimi 中安装这些技能,您可以实现数据处理自动化、进行更深入的分析,并构建更高效的工作流来处理复杂数据集。以下是 6 种值得探索的开源数据分析技能。
| Skill name | Description | URL |
|---|---|---|
| data-analytics-skills | A collection of 31 portable AI-powered skills covering the analyst workflow, including data quality checks, deep analysis, documentation, dashboard creation, and stakeholder communication. | https://github.com/nimrodfisher/data-analytics-skills |
| d3-visualization-skill | Comprehensive D3.js skill that helps agents create complex interactive data visualizations, including bar charts, line charts, force graphs, sankey diagrams, treemaps, sunbursts, and choropleth maps for dashboards and reports. | https://github.com/nexu-io/open-design/blob/main/skills/d3-visualization/SKILL.md |
| tufte-data-viz-skill | Applies Edward Tufte's data visualization principles, including high data-ink ratio, minimal chart clutter, direct labels, small multiples, and sparklines, to create clean and accessible charts across visualization libraries. | https://github.com/caylent/tufte-data-viz |
| mckinsey-style-visualization-skill | Helps transform raw business notes into executive-ready consulting visuals with insight-driven headlines, visual hierarchy, reusable slide specifications, and quality evaluation frameworks. | https://github.com/kgraph57/mckinsey-style-visualization-skill |
| data-visualization-report-skill | Converts CSV, Excel, or JSON data into polished visual reports with KPI cards, Chart.js charts, and data tables. Supports template-based report generation for business and finance scenarios. | https://github.com/nexu-io/open-design/blob/main/skills/data-report/SKILL.md |
| analytics-tracking-measurement-strategy | Helps design, audit, and improve analytics tracking systems through measurement strategies, event taxonomies, data quality reviews, and tracking implementation workflows. | https://github.com/diegosouzapw/awesome-omni-skills/blob/main/skills/analytics-tracking/SKILL.md |
Use open-source data analysis skills with Kimi在 Kimi 中使用开源数据分析技能
Follow these simple steps to install an open-source AI skill in Kimi and use it for advanced data analysis and reporting tasks.请按照以下简单步骤在 Kimi 中安装开源 AI 技能,并将其用于高级数据分析和报告任务。
Step 1: Enter a prompt第 1 步:输入提示词
Open Kimi Chat and provide a prompt with the GitHub URL of the open-source data analysis skill you want to install.打开 Kimi Chat,输入一条包含您想要安装的开源数据分析技能的 GitHub URL 的提示词。
Example prompt:
Step 2: Let AI install the skill automatically第 2 步:让 AI 自动安装技能
Kimi automatically downloads, configures, and prepares the skill based on the provided GitHub URL. Once the installation is complete, the skill becomes available in your workspace.Kimi 会根据提供的 GitHub URL 自动下载、配置并准备该技能。安装完成后,该技能即可在您的工作区中使用。
Step 3: Use the skill第 3 步:使用该技能
Click "Add to my skills" to add the installed skill to Kimi, then select "Try it" to activate it. Once enabled, upload your dataset or describe your analysis task, and the skill will help clean data, perform calculations, generate insights, and create structured reports more efficiently.点击“添加到我的技能”将已安装的技能添加到 Kimi,然后选择“尝试一下”来激活它。启用后,上传您的数据集或描述您的分析任务,该技能将帮助您更高效地清理数据、执行计算、生成见解并创建结构化报告。
Take data analysis further with custom AI skills利用自定义 AI 技能进一步提升数据分析能力
Follow these simple steps to build a custom AI skill that automates your data analysis workflows and makes recurring tasks more efficient.请按照以下简单步骤构建自定义 AI 技能,以自动化您的数据分析工作流并提高重复性任务的效率。
Step 1: Access the "Document to skills" tool第 1 步:访问“文档转技能”工具
Open Kimi Skills and click "Document to skills." This feature allows you to convert your data analysis documents into reusable AI skills.打开 Kimi 技能中心并点击“文档转技能”。此功能允许您将数据分析文档转换为可复用的 AI 技能。
Step 2: Upload the files第 2 步:上传文件
Upload spreadsheets, CSV files, reports, SQL documentation, analysis guides, or workflow documents containing the knowledge you want to automate. Kimi extracts key information and builds a structured AI skill.上传包含您想要自动化的知识的电子表格、CSV 文件、报告、SQL 文档、分析指南或工作流文档。Kimi 将提取关键信息并构建出一个结构化的 AI 技能。
Step 3: Create and use your skills第 3 步:创建并使用您的技能
Review the generated AI skill, refine its instructions if needed, and save it to your workspace. You can then use custom skills to automate data processing, generate reports, and streamline future analysis tasks.查看生成的 AI 技能,根据需要优化其指令,并将其保存到您的工作区。之后,您可以使用自定义技能来自动化数据处理、生成报告并简化未来的分析任务。
You can edit it anytime or export it as an .md file for sharing and use in other projects.您可以随时对其进行编辑,或将其导出为 .md 文件以便分享并在其他项目中使用。
Tips for using AI data analysis skills使用 AI 数据分析技能的技巧
Using AI effectively starts with providing the right data and clear instructions. Follow these best practices to improve the accuracy of your data analysis skills and generate more meaningful insights.有效使用 AI 始于提供正确的数据和明确的指令。遵循以下最佳实践,以提高您数据分析技能的准确性并生成更有意义的见解。
Define clear analysis goals first首先明确分析目标
Provide AI agents with specific questions, objectives, and expected outputs to help them focus on relevant data and generate more useful insights.向 AI 智能体提供具体的问题、目标和预期输出,以帮助它们聚焦于相关数据并生成更有用的见解。
Prepare and validate your data before analysis在分析前准备并验证数据
Ensure datasets are complete, properly formatted, and free from obvious errors. Clean data helps AI agents produce more accurate analysis results.确保数据集完整、格式正确且没有明显的错误。干净的数据有助于 AI 智能体得出更准确的分析结果。
Choose skills based on your analysis needs根据分析需求选择技能
Use different skills for different tasks, such as data cleaning, visualization, reporting, forecasting, or dashboard creation.针对不同任务使用不同的技能,例如数据清理、可视化、报告撰写、预测或仪表板创建。
Provide context and business background提供背景和业务语境
Include information about the dataset, industry, target audience, and decision goals so AI agents can interpret results more effectively.包含有关数据集、行业、目标受众和决策目标的信息,以便 AI 智能体更有效地解读结果。
Review and refine AI-generated insights审查并优化 AI 生成的见解
Check analysis results, validate important findings, and adjust instructions when needed to improve the accuracy and consistency of future outputs.检查分析结果,验证重要发现,并在需要时调整指令,以提高未来输出的准确性和一致性。
Conclusion结语
Whether you're developing basic data analysis skills or automating complex workflows, AI can save time while improving accuracy. Strong data analysis skills help you process information more efficiently and make better data-driven decisions. With Kimi, you can leverage Skills store, open-source, and custom AI skills to simplify data analysis and turn raw data into actionable insights.无论您是在培养基础数据分析技能还是在自动化复杂的工作流,AI 都能在提高准确性的同时节省时间。强大的数据分析技能有助于您更高效地处理信息并做出更好的数据驱动型决策。通过 Kimi,您可以利用技能商店、开源和自定义 AI 技能来简化数据分析,并将原始数据转化为可操作的见解。