
LiteLLM: AI Gateway for LLMs — Features OverviewLiteLLM:大语言模型(LLM)的 AI 网关 — 功能概览


In the previous posts on OpenTelemetry and VictoriaTraces (see OpenTelemetry: OTel Collectors in Kubernetes and integration with the VictoriaMetrics stack and VictoriaTraces: Tracing, Observability and OpenTelemetry) we covered the general concepts of what observability is and how to work with traces.在之前关于 OpenTelemetry 和 VictoriaTraces 的文章(参见《OpenTelemetry:Kubernetes 中的 OTel Collector 及与 VictoriaMetrics 栈的集成》和《VictoriaTraces:追踪、可观测性与 OpenTelemetry》)中,我们介绍了可观测性的基本概念以及如何处理追踪数据。
But this topic actually came up on the project when we realized that using LLMs is becoming an important part of our product — but unlike the other components, I have no monitoring at all of how the LLM is actually used, how many tokens each service spends, how many errors we get.但这个话题实际上是在项目中产生的,当时我们意识到 LLM 正成为产品的重要组成部分。与其他组件不同,我们完全没有监控 LLM 的实际使用情况、每个服务消耗的 Token 数量以及产生的错误数量。
So we started “wrapping” all of this in tracing to get data from our services. On top of that, we have a separate homegrown OpenAI Exporter that collects token and cost data from the OpenAI API.因此,我们开始将所有内容“封装”在追踪中,以便从服务中获取数据。此外,我们还有一个自研的 OpenAI Exporter,用于从 OpenAI API 收集 Token 和成本数据。
That said, once we’d “wrapped” everything and started pulling data from different systems into a single backend — VictoriaMetrics/VictoriaTraces — and building dashboards in Grafana and metrics with VMAlert, one unpleasant thing turned up: different components use different libraries to work with LLMs, different libraries to create spans, create attributes differently — so we end up having to build different dashboards and different alerts.话虽如此,一旦我们将所有内容“封装”好,并开始将不同系统的数据提取到同一个后端(VictoriaMetrics/VictoriaTraces)中,并在 Grafana 中构建仪表盘、利用 VMAlert 设置指标时,一个令人不快的问题出现了:不同的组件使用不同的库来处理 LLM,创建 Span 的方式不同,属性设置也不同,导致我们最终不得不构建各种不同的仪表盘和告警。
There are options to solve this, of course: either rewrite the code of all the systems to use the same libraries — or create custom span attributes so they’re identical across all services.当然,解决这个问题的方法有很多:要么重写所有系统的代码以使用相同的库,要么创建自定义的 Span 属性,使它们在所有服务中保持一致。
But that’s, first — a lot of code changes, and second — I don’t want to restrict the developers with rules like “use only this library” or “always add these attributes to your spans”.但这首先意味着大量的代码变更;其次,我不想用“只能使用这个库”或“必须在 Span 中添加这些属性”之类的规则来限制开发人员。
So I decided to look at a different approach: let everyone do whatever they want — but route all the requests from all the systems through a single gateway, an AI Gateway — and it will create the traces and metrics itself — and then everyone will share a common context in the form of common attributes/labels/metrics.所以我决定尝试另一种方法:让每个人随心所欲地开发,但将所有系统的请求通过一个单一的网关(AI Gateway)进行路由。由网关自行创建追踪和指标,这样每个人都能在通用的属性、标签和指标形式下共享统一的上下文。
Besides, a common gateway solves a whole bunch of other tasks — centralized access management, budgets with limits, and failover between OpenAI/Anthropic if one system goes down.此外,通用网关还能解决一系列其他任务:集中式访问管理、预算限额,以及当某个系统宕机时在 OpenAI/Anthropic 之间实现故障转移。
Today we’ll take a look at what LiteLLM is in general, run it locally in Docker, and then, if I like it (and so far — I do, though a few questions came up) — we’ll launch it in Kubernetes and integrate it with our existing monitoring stack — VictoriaMetrics, VictoriaLogs, VictoriaTraces, Grafana.今天我们将大致了解 LiteLLM 是什么,在 Docker 中本地运行它,如果我喜欢它(到目前为止我确实很喜欢,尽管出现了一些疑问),我们将在 Kubernetes 中部署它,并将其与我们现有的监控栈(VictoriaMetrics、VictoriaLogs、VictoriaTraces、Grafana)集成。
This is the first post about running LiteLLM, all parts are:这是关于运行 LiteLLM 的第一篇文章,所有部分如下:
- (current) LiteLLM: AI Gateway for LLMs — Features Overview(当前)LiteLLM:大语言模型(LLM)的 AI 网关 — 功能概览
- LiteLLM: AI Gateway on Kubernetes and Metrics in VictoriaMetricsLiteLLM:Kubernetes 上的 AI 网关及 VictoriaMetrics 中的指标
- LiteLLM: Metrics, Traces, and VictoriaMetrics Stack IntegrationLiteLLM:指标、追踪与 VictoriaMetrics 栈的集成
And more are coming soon, so stay tuned for updates and follow my Telegram channel @rtfmcoua_en or LinkedIn group RTFM! DevOps[at]UA.更多内容即将推出,请关注更新,或订阅我的 Telegram 频道 @rtfmcoua_en 以及 LinkedIn 小组 RTFM! DevOps[at]UA。
Contents目录
- LiteLLM — main featuresLiteLLM — 主要功能
- Why do we need this?为什么需要这个?
- Running LiteLLM with Docker使用 Docker 运行 LiteLLM
- Config.yaml — LiteLLM configurationConfig.yaml — LiteLLM 配置
- Demo Python App — AI Client演示 Python 应用 — AI 客户端
- Monitoring, OpenTelemetry and Traces监控、OpenTelemetry 与追踪
- OpenTelemetry and VictoriaTracesOpenTelemetry 与 VictoriaTraces
- LiteLLM Span AttributesLiteLLM Span 属性
- Access Management访问管理
- Authentication and access身份验证与访问
- Teams and Users团队与用户
- Budgets and limits预算与限额
- RBAC and System RolesRBAC 与系统角色
- Creating a Team创建团队
- Creating a User in the Web UI在 Web UI 中创建用户
- Team Permissions团队权限
- Creating a User API Key for a Team in the Web UI在 Web UI 中为团队创建用户 API 密钥
- Creating a User API Key in the Web UI without a Team and without Limits在 Web UI 中创建无团队且无限制的用户 API 密钥
- Creating a User and API Key via the LiteLLM API with a Rate Limit通过 LiteLLM API 创建具有速率限制的用户及 API 密钥
- Instead of conclusions结语之外
LiteLLM — main features
The project page is litellm.ai, all the documentation is at docs.litellm.ai, the project’s GitHub is BerriAI/litellm.项目主页为 litellm.ai,所有文档位于 docs.litellm.ai,项目 GitHub 为 BerriAI/litellm。
So, what LiteLLM is: it’s a system for building a single gateway that proxies all requests to LLMs and various providers through itself — the Backend API can send requests to AWS Bedrock for RAG, client AI Agents can send requests to OpenAI or Anthropic, and you can even route the developers’ Claude Code through this gateway and get a picture of who uses how many tokens (although in the Claude Code case there’s the matter of API usage, since LiteLLM apparently can’t work through a subscription — only the API).那么,LiteLLM 是什么:它是一个用于构建单一网关的系统,通过该网关代理所有发往 LLM 和各种提供商的请求。后端 API 可以将请求发送到 AWS Bedrock 进行 RAG,客户端 AI Agent 可以向 OpenAI 或 Anthropic 发送请求,甚至可以将开发人员的 Claude Code 路由通过此网关,从而了解谁消耗了多少 Token(尽管在 Claude Code 的情况下存在 API 使用问题,因为 LiteLLM 显然无法通过订阅工作,只能通过 API)。
At the same time, we calmly keep the existing metrics and traces that are already generated by the services — because they’re already familiar to the developers and somewhat integrated into our monitoring. And on top of them — we get new ones, with a common context for our whole project and the AI/LLM in it.同时,我们从容地保留了服务已生成的现有指标和追踪,因为开发人员已经熟悉它们,并且它们在一定程度上集成到了我们的监控中。在此基础上,我们获得了新的指标和追踪,为整个项目及其中的 AI/LLM 提供了通用的上下文。
There’s also a LiteLLM Python SDK — you can have all of LiteLLM’s features right from your code without needing to spin up a separate proxy service.此外还有一个 LiteLLM Python SDK — 你可以直接在代码中拥有 LiteLLM 的所有功能,而无需启动单独的代理服务。
Some of LiteLLM’s interesting features:LiteLLM 的一些有趣功能:
- Admin Web UI: a single web interface for monitoring and configuration管理 Web UI:用于监控和配置的单一 Web 界面
- Alerting & Monitoring: out of the box we get logs, metrics, alerts, and integration with Prometheus/VictoriaMetrics and systems like Phoenix/Langfuse告警与监控:开箱即用,提供日志、指标、告警,并集成了 Prometheus/VictoriaMetrics 以及 Phoenix/Langfuse 等系统
- Cost tracking: out of the box it automatically monitors model usage costs, returns metrics and traces with cost data, and you can configure budgets for different keys, teams, and users成本追踪:自动监控模型使用成本,返回包含成本数据的指标和追踪,并且可以为不同的密钥、团队和用户配置预算
- Centralized authentication: a single system for managing access — groups, users, keys, separate budgets and limits, and even restricting access to LiteLLM by IP集中式身份验证:用于管理访问的单一系统 — 包括组、用户、密钥、独立的预算和限额,甚至可以通过 IP 限制对 LiteLLM 的访问
- Budgets, Rate Limits: lots of settings for controlling provider usage预算与速率限制:用于控制提供商使用情况的大量设置
- Skills Registry: keep all your skills in one place — but this seems to be only for Claude Code技能注册表(Skills Registry):将所有技能保存在一个地方,但这似乎仅适用于 Claude Code
- MCP Gateway: you can have all your configured MCP servers on LiteLLM — and clients like VSCode, Cursor, Claude Code just talk to itMCP 网关:可以在 LiteLLM 上配置所有 MCP 服务器,VSCode、Cursor、Claude Code 等客户端只需与它通信即可
- Agent Gateway: you can have a proxy for agent-to-agent communication and monitor all that activityAgent 网关:可以作为 Agent 间通信的代理并监控所有活动
- LLM Response caching: LiteLLM can keep a cache of responses from the LLM — for the same request from a client it returns a cached response instead of making a new request to the LLM (see also Prompt Caching)LLM 响应缓存:LiteLLM 可以缓存 LLM 的响应,对于客户端的相同请求,它会返回缓存响应,而不是向 LLM 发起新请求(参见 Prompt Caching)
- Memory: storing settings and context between sessions内存:在会话间存储设置和上下文
- Vector Store: LiteLLM can act as a proxy to various Vector Stores and record additional data for monitoring向量存储(Vector Store):LiteLLM 可以作为各种向量存储的代理,并记录额外数据以供监控
- Guardrails: protecting sensitive data — prompt injection, masking user data护栏(Guardrails):保护敏感数据,防止提示词注入,掩码用户数据
- Policies: there’s a set of ready-made policies, and you can create your own策略:提供了一套现成的策略,你也可以创建自己的策略
- Load Balancing: automatic balancing between different providers and/or models depending on load or priorities负载均衡:根据负载或优先级在不同提供商和/或模型之间自动均衡
- Model Health Status: checking the LLM status and excluding from routing the providers that are unavailable模型健康状态:检查 LLM 状态,并将不可用的提供商从路由中排除
- Fallbacks: automatic request routing if a model or provider is unavailable故障转移(Fallbacks):如果模型或提供商不可用,自动进行请求路由
- Traffic Mirroring: an interesting feature — sending requests to two different models at once so you can compare the results of their work流量镜像:一个有趣的功能,同时向两个不同的模型发送请求,以便比较它们的工作结果
Why do we need this?
Every time you want to spin up something new — you have to ask yourself “And what problem, exactly, are we solving?”每次你想启动新东西时,都必须问自己:“我们到底在解决什么问题?”
In our specific case it’s:在我们的具体案例中:
- access management: instead of a gazillion API keys in OpenAI/Anthropic — having configured groups in LiteLLM, each with its own budgets and limits访问管理:不再需要在 OpenAI/Anthropic 中管理无数个 API 密钥,而是在 LiteLLM 中配置组,每个组都有自己的预算和限额
- monitoring: having common metrics, logs, and traces with common labels/attributes监控:拥有带有通用标签/属性的通用指标、日志和追踪
- failover: being able to automatically switch to another provider if we hit the limits on the current one (or if Claude goes down again)故障转移:能够在当前提供商达到限额(或 Claude 再次宕机)时自动切换到另一个提供商
Running LiteLLM with Docker
For Lite to work properly it needs a database — it’ll store all the users and groups, model settings, budgets, and LLM spend, see What is stored in the DB.为了正常工作,LiteLLM 需要一个数据库,它将存储所有用户和组、模型设置、预算和 LLM 支出,参见“数据库中存储了什么”。
So with Docker we’ll create two containers — the Gateway itself and a PostgreSQL for it.因此,通过 Docker,我们将创建两个容器:网关本身和配套的 PostgreSQL。
Documentation — Getting Started Tutorial.文档 — 入门教程。
For a Production setup it’s also worth adding Redis — but we’ll talk about that in the next part. See Deployment Options and High Availability Setup (Resolve DB Deadlocks).对于生产环境,建议添加 Redis,但我们将在下一部分讨论。参见“部署选项与高可用性设置(解决数据库死锁)”。
For running in Kubernetes there’s a Helm chart (beta) and an unofficial litellm-operator.对于在 Kubernetes 中运行,有一个 Helm chart(测试版)和一个非官方的 litellm-operator。
Config.yaml — LiteLLM configuration
Before launching LiteLLM we need a config for how it’ll work — see the documentation Config.yaml, and all the parameters in All settings.在启动 LiteLLM 之前,我们需要一个配置来定义其工作方式,参见文档 Config.yaml 以及“所有设置”中的所有参数。
We create a litellm_config.yaml file with minimal settings:我们创建一个包含最小设置的 litellm_config.yaml 文件:
model_list:
  - model_name: gpt-4o-mini
    litellm_params:
      model: openai/gpt-4o-mini
      api_key: os.environ/OPENAI_API_KEY

general_settings:
  master_key: os.environ/LITELLM_MASTER_KEY

litellm_settings:
  callbacks:
- prometheusHere:其中:
model_list: the list of models that will be available to clients - see LLM configs model_listmodel_list:客户端可用的模型列表,参见 LLM 配置 model_listmodel_name: the name we get in the request from the client (how we'll specify it in the code, e.g.client.chat.completions.create(model="gpt-4o-mini"))model_name:我们在客户端请求中获取的名称(我们在代码中指定它的方式,例如 client.chat.completions.create(model="gpt-4o-mini"))- each model in this list is a separate deployment in LiteLLM terminology — see Quick Start and Proxy — Load Balancing此列表中的每个模型在 LiteLLM 术语中都是一个单独的部署,参见“快速入门”和“代理 — 负载均衡”
litellm_params: the provider parameters for this modellitellm_params:此模型的提供商参数general_settings: see General Settings general_settingsgeneral_settings:参见“通用设置” general_settingsmaster_key: the main key for authentication and for the admin in the Web UImaster_key:用于身份验证和 Web UI 管理员的主密钥- you can also pass the database parameters here, but for now we’ll do it via environment variables你也可以在这里传入数据库参数,但目前我们通过环境变量来完成
litellm_settings: settings for LiteLLM itself - monitoring, logging, caching, see litellm_settings - Referencelitellm_settings:LiteLLM 本身的设置 — 监控、日志记录、缓存,参见 litellm_settings - 参考callbacks: we expose metrics (the/metrics/endpoint), later we'll add trace sending here, see Prometheus metricscallbacks:我们暴露指标(/metrics/ 端点),稍后我们将在此处添加追踪发送,参见 Prometheus 指标
We create a docker-compose.yml - describing how to run LiteLLM itself and the PostgreSQL for it:我们创建一个 docker-compose.yml,描述如何运行 LiteLLM 本身及其 PostgreSQL:
services:
  postgres:
    image: postgres:16-alpine
    environment:
      POSTGRES_USER: litellm
      POSTGRES_PASSWORD: litellm
      POSTGRES_DB: litellm
    volumes:
      - postgres_data:/var/lib/postgresql/data
    healthcheck:
      test: ["CMD-SHELL", "pg_isready -U litellm"]
      interval: 5s
      timeout: 5s
      retries: 5

  litellm:
    image: ghcr.io/berriai/litellm:main-latest
    ports:
      - "4000:4000"
    volumes:
      - ./litellm_config.yaml:/app/config.yaml
    env_file:
      - .env
    environment:
      DATABASE_URL: postgresql://litellm:litellm@postgres:5432/litellm
      LITELLM_LOG: DEBUG
    command: ["--config", "/app/config.yaml", "--port", "4000"]
    depends_on:
      postgres:
        condition: service_healthy

volumes:
  postgres_data:
Here we have PostgreSQL with a health check used by the LiteLLM instance, and through the DATABASE_URL environment variable we pass LiteLLM the connection string to connect to the database.这里我们有带有健康检查的 PostgreSQL,供 LiteLLM 实例使用;通过 DATABASE_URL 环境变量,我们将数据库连接字符串传递给 LiteLLM。
We generate a key for $LITELLM_MASTER_KEY - in OpenAI format, with the sk- prefix ("secret key"):我们为 $LITELLM_MASTER_KEY 生成一个密钥,采用 OpenAI 格式,带有 sk- 前缀(“秘密密钥”):
$ echo "sk-$(openssl rand -hex 16)"
sk-db69761228204509fa80f934bff6e0f5
We set it in an environment variable:我们在环境变量中设置它:
$ export LITELLM_MASTER_KEY=sk-db69761228204509fa80f934bff6e0f5We create a .env file with the API key for OpenAI and for LiteLLM itself:我们创建一个 .env 文件,其中包含 OpenAI 的 API 密钥和 LiteLLM 本身的密钥:
$ echo "OPENAI_API_KEY=$OPENAI_API_KEY" > .env
$ echo "LITELLM_MASTER_KEY=$LITELLM_MASTER_KEY" >> .env
We launch it — the first run will take a few minutes while all the migrations roll into the database.我们启动它 — 第一次运行需要几分钟,因为所有迁移都要写入数据库。
We wait for the messages “Application startup complete” and “Uvicorn running on”:我们等待显示“Application startup complete”和“Uvicorn running on”的消息:
$ docker compose up
...
litellm-1   | INFO:     Waiting for application startup.
litellm-1   |
litellm-1   |    ██╗     ██╗████████╗███████╗██╗     ██╗     ███╗   ███╗
litellm-1   |    ██║     ██║╚══██╔══╝██╔════╝██║     ██║     ████╗ ████║
litellm-1   |    ██║     ██║   ██║   █████╗  ██║     ██║     ██╔████╔██║
litellm-1   |    ██║     ██║   ██║   ██╔══╝  ██║     ██║     ██║╚██╔╝██║
litellm-1   |    ███████╗██║   ██║   ███████╗███████╗███████╗██║ ╚═╝ ██║
litellm-1   |    ╚══════╝╚═╝   ╚═╝   ╚══════╝╚══════╝╚══════╝╚═╝     ╚═╝
litellm-1   |
litellm-1   | query-engine ac9d7041ed77bcc8a8dbd2ab6616b39013829574
litellm-1   | INFO:     Application startup complete.
litellm-1   | INFO:     Uvicorn running on http://0.0.0.0:4000 (Press CTRL+C to quit)
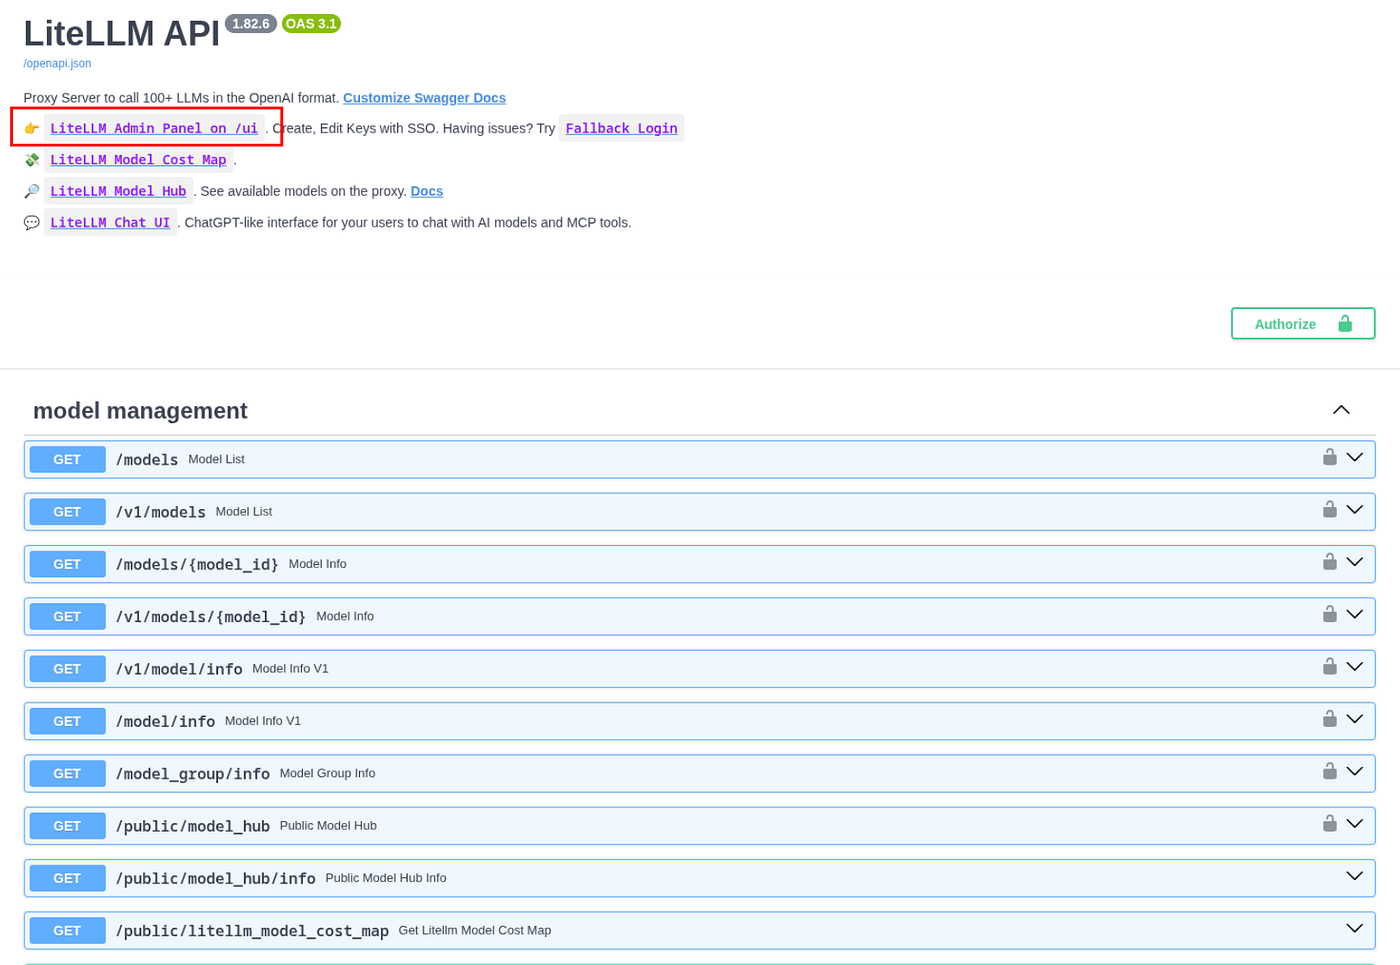
We go to http://0.0.0.0:4000 — here there’s a link to the Admin UI and the documentation for the LiteLLM API itself (the Swagger Docs can be disabled with NO_DOCS=true, see environment variables - Reference, but overall it's worth a look - because the API has a ton of features):我们访问 http://0.0.0.0:4000 — 这里有指向 Admin UI 和 LiteLLM API 本身文档的链接(Swagger 文档可以通过 NO_DOCS=true 禁用,参见“环境变量 - 参考”,但总体而言值得一看,因为 API 有大量功能):
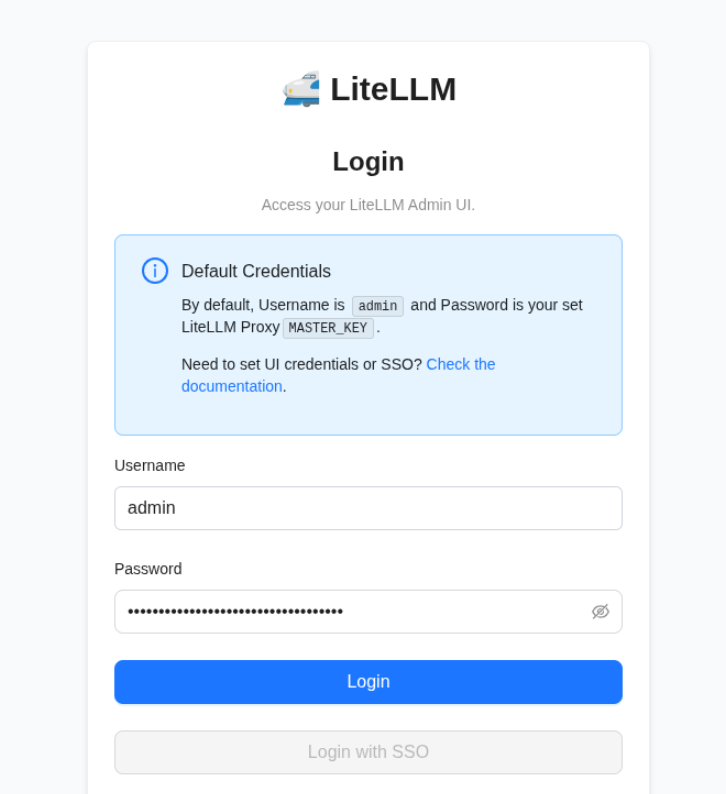
We log into the admin panel — the default login is “admin”, the password is $LITELLM_MASTER_KEY, which we created above:我们登录管理面板 — 默认用户名为“admin”,密码为我们上面创建的 $LITELLM_MASTER_KEY:
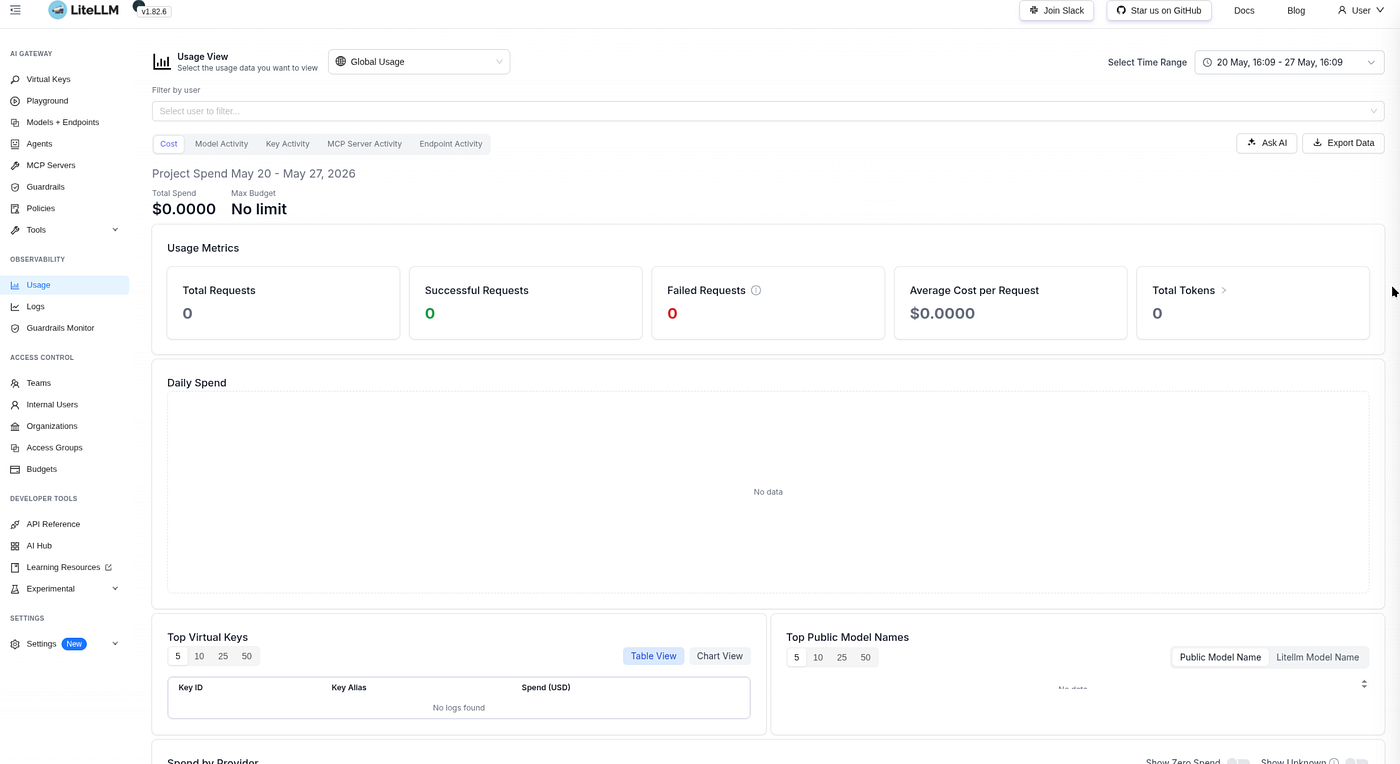
And we land in a really nice interface:我们进入了一个非常漂亮的界面:
We already have metrics, but the endpoint is exactly /metrics/ - with a trailing slash (even though the documentation lists it as /metrics):我们已经有了指标,但端点正是 /metrics/ — 带有一个尾随斜杠(尽管文档将其列为 /metrics):
$ curl -s http://localhost:4000/metrics/
...
# HELP litellm_in_flight_requests Number of HTTP requests currently in-flight on this uvicorn worker
# TYPE litellm_in_flight_requests gauge
litellm_in_flight_requests 1.0
We’ll go through the various settings later — for now let’s create a “client” — a simple script that talks to OpenAI through LiteLLM.我们稍后会浏览各种设置 — 现在让我们创建一个“客户端”,一个通过 LiteLLM 与 OpenAI 通信的简单脚本。
Demo Python App — AI Client
We write a script that uses OpenAI and passes a single prompt:我们编写一个使用 OpenAI 并传递单个提示词的脚本:
#!/usr/bin/env python

import os
from openai import OpenAI

client = OpenAI(
    base_url="http://localhost:4000",
    api_key=os.getenv("LITELLM_MASTER_KEY"),
)

response = client.chat.completions.create(
    model="gpt-4o-mini",
    messages=[{"role": "user", "content": "Say hello in one sentence"}],
)

print(response.choices[0].message.content)
print(f"Tokens: {response.usage}")
Here:
base_urlfor OpenAI: instead of the default OpenAI endpoint api.openai.com we override it with our LiteLLM instance's endpointOpenAI 的 base_url:我们用 LiteLLM 实例的端点覆盖了默认的 OpenAI 端点 api.openai.commodel: the model name as we set it in the LiteLLM parameters -model_list.model_namemodel:我们在 LiteLLM 参数中设置的模型名称 - model_list.model_name
We install the dependencies:我们安装依赖项:
$ python3 -m venv .venv
$ source .venv/bin/activate
$ pip install openai
We run the script:我们运行脚本:
$ ./demo-llm.py
Hello! How can I assist you today?
Tokens: CompletionUsage(completion_tokens=9, prompt_tokens=12, total_tokens=21, completion_tokens_details=CompletionTokensDetails(accepted_prediction_tokens=0, audio_tokens=0, reasoning_tokens=0, rejected_prediction_tokens=0), prompt_tokens_details=PromptTokensDetails(audio_tokens=0, cached_tokens=0))
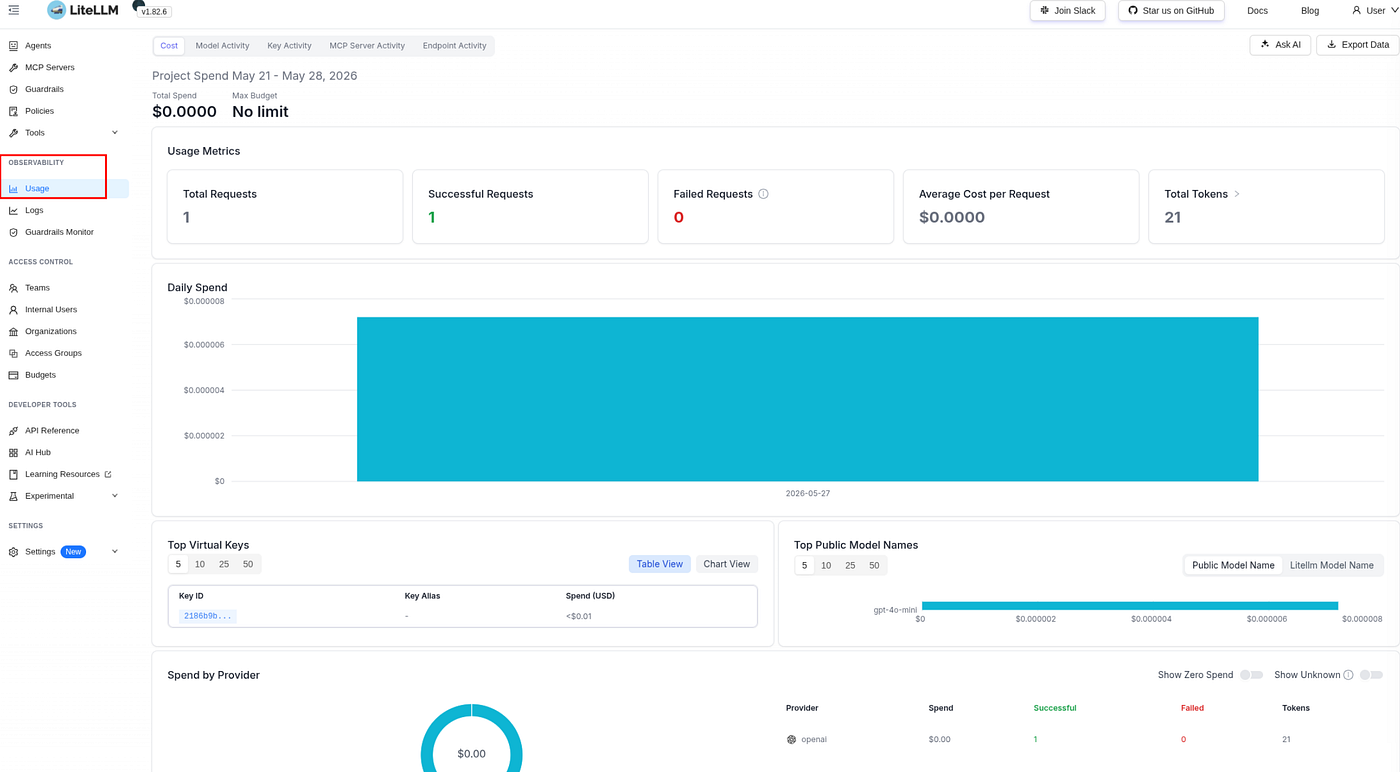
We go to the admin panel > Usage — and we already have data on the requests:我们进入管理面板 > Usage — 我们已经有了请求数据:
We look at the traces in Logs:我们在 Logs 中查看追踪:
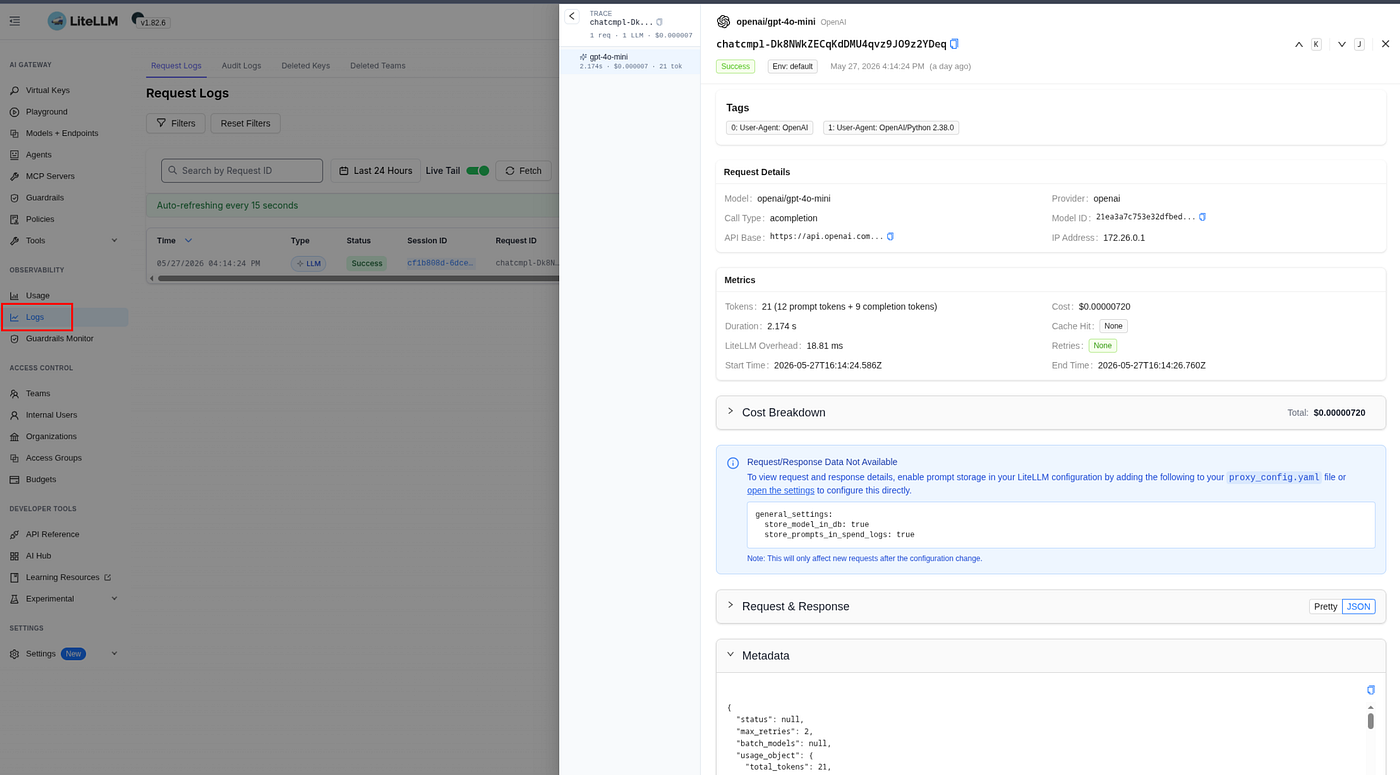
And the new metrics:以及新的指标:
$ curl -s http://localhost:4000/metrics/ | grep "# HELP lite"
# HELP litellm_in_flight_requests Number of HTTP requests currently in-flight on this uvicorn worker
# HELP litellm_proxy_failed_requests_metric_total Total number of failed responses from proxy - the client did not get a success response from litellm proxy
# HELP litellm_proxy_total_requests_metric_total Total number of requests made to the proxy server - track number of client side requests
# HELP litellm_proxy_total_requests_metric_created Total number of requests made to the proxy server - track number of client side requests
...
# HELP litellm_total_users Total number of users in LiteLLM
# HELP litellm_teams_count Total number of teams in LiteLLM
Now that we have LiteLLM itself and a client — we can look at the interesting things we can do with LiteLLM, and the first thing I personally care about is monitoring.现在我们有了 LiteLLM 本身和一个客户端,我们可以看看 LiteLLM 能做哪些有趣的事情,我个人最关心的是监控。
Monitoring, OpenTelemetry and Traces
We’ll collect metrics with VMAgent or the OTel Collector, the logs are just the output, which — if it’s in Kubernetes — we collect with Promtail, vlagent, the OTel filelog, whatever.我们将使用 VMAgent 或 OTel Collector 收集指标,日志只是输出内容,如果是 Kubernetes 环境,我们可以用 Promtail、vlagent、OTel filelog 等收集。
We’ll go over the interesting metrics later, but we won’t collect them today — because everything’s local in Docker right now, the documentation on all the available metrics is Prometheus metrics.稍后我们将讨论有趣的指标,但今天我们不会收集它们,因为现在一切都在 Docker 中本地运行。关于所有可用指标的文档在 Prometheus 指标中。
But we can take a look at how to write traces to VictoriaTraces.但我们可以看看如何将追踪写入 VictoriaTraces。
Documentation — OpenTelemetry and OpenTelemetry — Tracing LLMs with any observability tool.文档 — OpenTelemetry 和 OpenTelemetry — 使用任何可观测性工具追踪 LLM。
OpenTelemetry and VictoriaTraces
LiteLLM can write data using the OpenTelemetry Protocol. For VictoriaTraces we use the /insert/opentelemetry/v1/traces endpoint, see Data ingestion.LiteLLM 可以使用 OpenTelemetry 协议写入数据。对于 VictoriaTraces,我们使用 /insert/opentelemetry/v1/traces 端点,参见“数据摄取”。
We open a local port to the VictoriaTraces instance in Kubernetes to get access from the Docker container with LiteLLM — we add --address=0.0.0.0:我们打开一个通往 Kubernetes 中 VictoriaTraces 实例的本地端口,以便从带有 LiteLLM 的 Docker 容器中进行访问 — 我们添加 --address=0.0.0.0:
$ kk port-forward svc/atlas-victoriametrics-vt-single-server 10428 --address=0.0.0.0In docker-compose.yaml we add the extra_hosts parameter:在 docker-compose.yaml 中,我们添加 extra_hosts 参数:
litellm:
  image: ghcr.io/berriai/litellm:main-latest
  ...
  extra_hosts:
    - "host.docker.internal:host-gateway"
In LiteLLM’s .env we add the variables for sending traces:在 LiteLLM 的 .env 中,我们添加用于发送追踪的变量:
OTEL_EXPORTER_OTLP_TRACES_ENDPOINT=http://host.docker.internal:10428/insert/opentelemetry/v1/traces
OTEL_EXPORTER_OTLP_PROTOCOL=http/protobuf
You can set it via LiteLLM’s own variables — OTEL_EXPORTER and OTEL_ENDPOINT:你可以通过 LiteLLM 自己的变量设置它 — OTEL_EXPORTER 和 OTEL_ENDPOINT:
OTEL_ENDPOINT=http://host.docker.internal:10428/insert/opentelemetry/v1/traces
OTEL_EXPORTER=otlp_http
A bit of a mess in the documentation (though the documentation is great overall) — but both options work. See also Exporter & resource.文档有点混乱(尽管总体来说文档很棒),但两种选项都有效。参见“Exporter & resource”。
In the litellm_config.yaml config we add "otel" to callbacks - turning on trace sending:在 litellm_config.yaml 配置中,我们在 callbacks 中添加 "otel" — 开启追踪发送:
...
litellm_settings:
  callbacks:
  - prometheus
  - otel
Instead of, or in addition to, “otel" you can specify "langfuse" or "arize" for Phoenix (see Arize Phoenix: an LLM monitoring service - running it in Kubernetes) - then the traces will be sent to several services at once - tested it, works, handy, neat.除了“otel”之外,你还可以为 Phoenix 指定“langfuse”或“arize”(参见《Arize Phoenix:一个 LLM 监控服务 — 在 Kubernetes 中运行》)——这样追踪将同时发送到多个服务——测试过了,有效,既方便又整洁。
Get Arseny Zinchenko (setevoy)’s stories in your inbox将 Arseny Zinchenko (setevoy) 的文章投递到你的收件箱
Join Medium for free to get updates from this writer.免费加入 Medium 以获取该作者的更新。
We restart the containers, and in the logs we should see that the exporters are active:我们重启容器,在日志中应该能看到 Exporter 已激活:
...
 11:31:57 - LiteLLM Proxy:DEBUG: callback_utils.py:34 - initializing callbacks=['prometheus', 'otel'] on proxy
...
litellm-1 | self.OTEL_EXPORTER: otlp_http
litellm-1 | self.OTEL_ENDPOINT: http://host.docker.internal:10428/insert/opentelemetry/v1/traces
litellm-1 | self.OTEL_HEADERS: None
...
We check that the environment variables from .env were applied - on the first run I had to debug a bit:我们检查 .env 中的环境变量是否已应用 — 第一次运行时我不得不调试了一下:
$ docker compose exec litellm env | grep OTEL
OTEL_EXPORTER_OTLP_TRACES_ENDPOINT=http://host.docker.internal:10428/insert/opentelemetry/v1/traces
OTEL_EXPORTER_OTLP_PROTOCOL=http/protobuf
We run our client script one more time:我们再次运行客户端脚本:
$ ./demo-llm.py
Hello! How can I assist you today?
Tokens: CompletionUsage(completion_tokens=9, prompt_tokens=12, total_tokens=21, completion_tokens_details=CompletionTokensDetails(accepted_prediction_tokens=0, audio_tokens=0, reasoning_tokens=0, rejected_prediction_tokens=0), prompt_tokens_details=PromptTokensDetails(audio_tokens=0, cached_tokens=0))
And in VictoriaTraces we search for spans by {"resource_attr:service.name"="litellm"}:在 VictoriaTraces 中,我们通过 {"resource_attr:service.name"="litellm"} 搜索 Span:
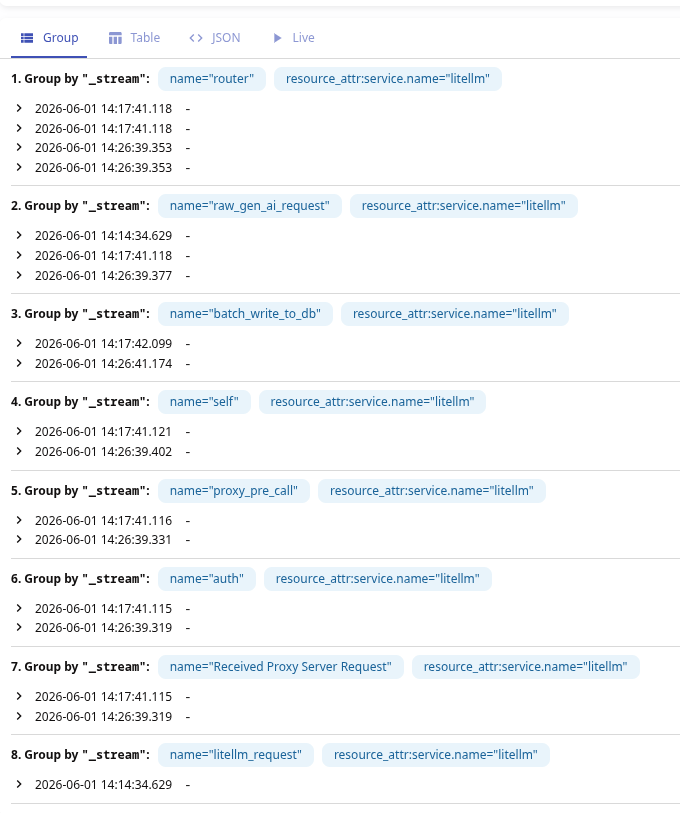
Or straight in Grafana with grouping:或者直接在 Grafana 中进行分组查看:
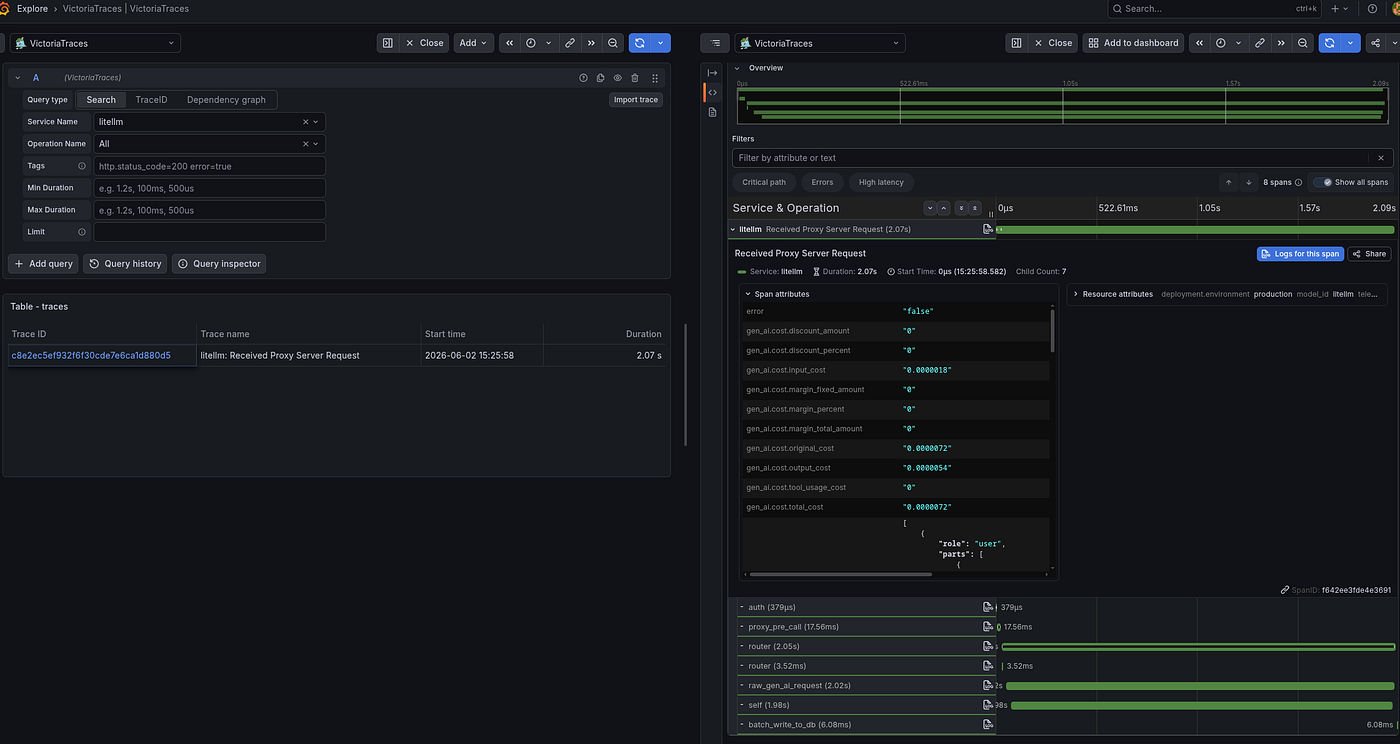
LiteLLM Span Attributes
There are really a lot of attributes — we just get everything right away, without any instrumentation in the code.属性确实非常多 — 我们无需在代码中进行任何插桩,就能直接获得所有内容。
Our “root” span will be “Received Proxy Server Request”, see Span Hierarchy and Span name reference.我们的“根”Span 将是“Received Proxy Server Request”,参见“Span 层级”和“Span 名称参考”。
See also the OpenTelemetry documentation itself Semantic conventions for generative client AI spans — span and attribute names.另请参阅 OpenTelemetry 文档本身《生成式 AI 客户端 Span 的语义约定 — Span 和属性名称》。
It’s easier to look at all the attributes together right in VictoriaTraces:直接在 VictoriaTraces 中查看所有属性会更方便:
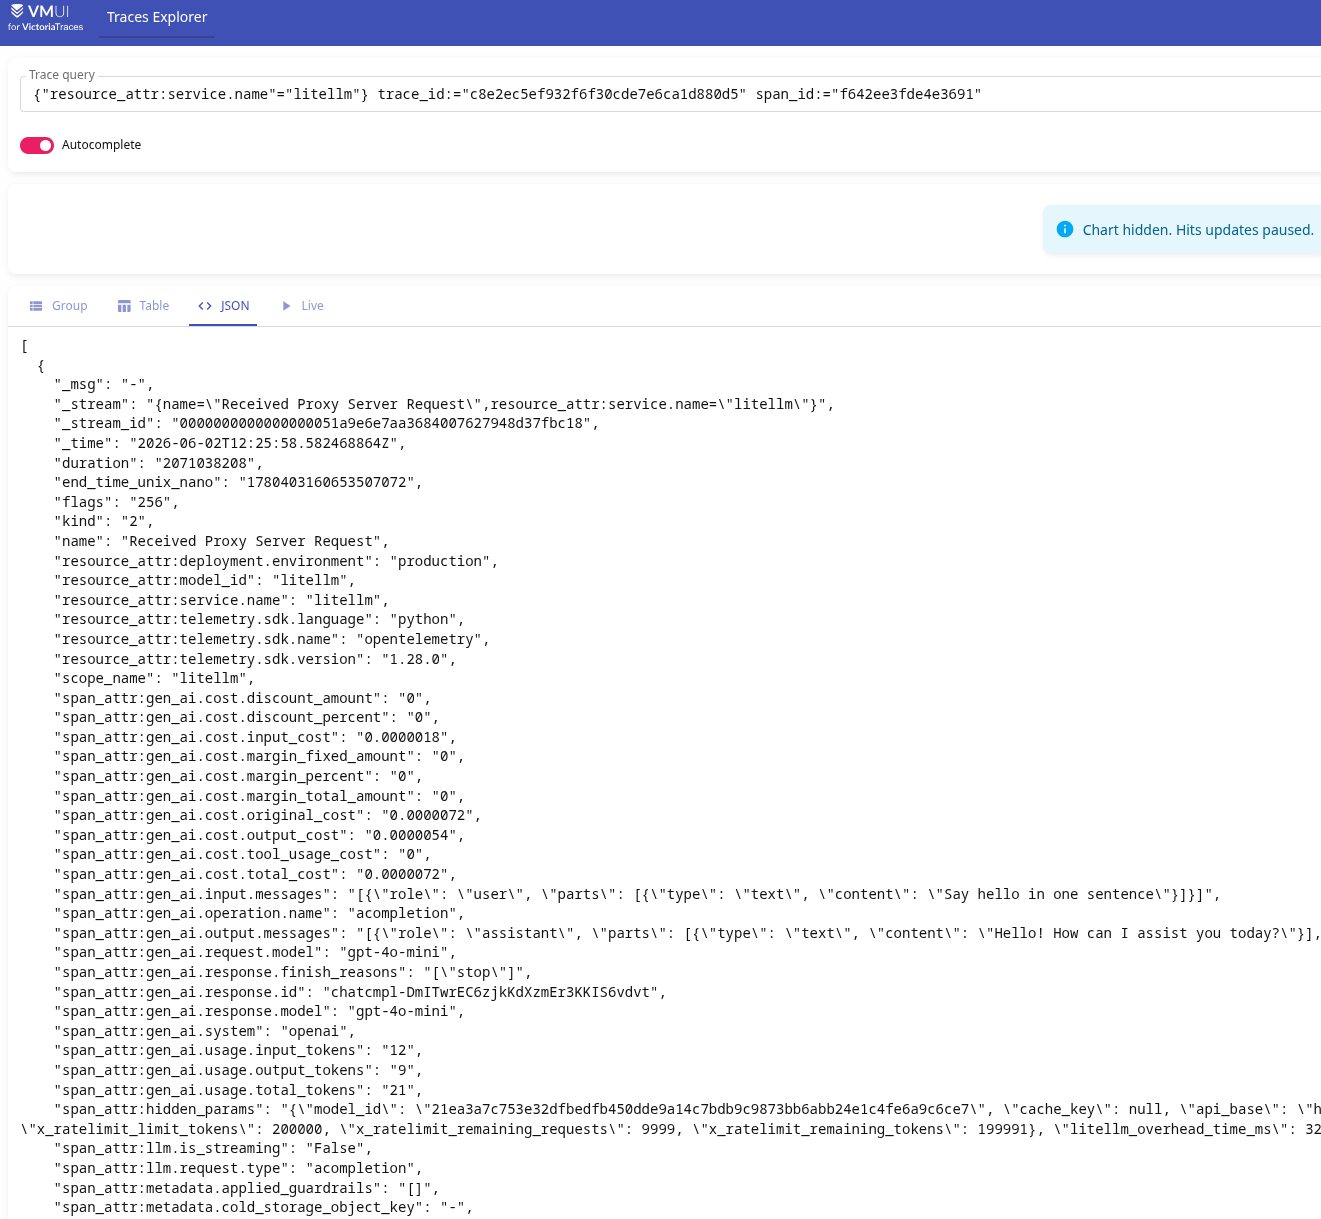
You can also include LiteLLM’s spans as children of the client’s spans, if tracing is configured there — see Context propagation (W3C traceparent).如果配置了追踪,你还可以将 LiteLLM 的 Span 作为客户端 Span 的子项包含进来,参见“上下文传播 (W3C traceparent)”。
For all the attributes see the Attributes Reference, here’s a brief rundown of the main ones that might be interesting later for monitoring.有关所有属性,请参阅“属性参考”,以下是稍后监控可能感兴趣的主要属性的简要说明。
Costs — you can build charts of spend by model, user, team:成本 — 你可以按模型、用户、团队构建支出图表:
gen_ai.cost.total_cost: how much money was spent processing the requestgen_ai.cost.total_cost:处理请求花费了多少钱gen_ai.cost.input_cost/gen_ai.cost.output_cost: a breakdown of the cost by input/output tokensgen_ai.cost.input_cost / gen_ai.cost.output_cost:按输入/输出 Token 划分的成本明细
Tokens Usage:Token 使用情况:
gen_ai.usage.input_tokens/output_tokens/total_tokensgen_ai.usage.input_tokens / output_tokens / total_tokens
Execution time — request processing time:执行时间 — 请求处理时间:
duration: the total processing timeduration:总处理时间hidden_params=>litellm_overhead_time_ms: how much time the proxy itself tookhidden_params => litellm_overhead_time_ms:代理本身花费的时间
Model and provider:模型与提供商:
gen_ai.request.model: which model was used in the requestgen_ai.request.model:请求中使用的模型gen_ai.response.model: which model actually responded (may differ, for example - if a fallback kicked in)gen_ai.response.model:实际响应的模型(可能不同,例如,如果触发了故障转移)gen_ai.system: the providergen_ai.system:提供商
User data:用户数据:
metadata.user_api_key_hash: which key was usedmetadata.user_api_key_hash:使用了哪个密钥metadata.user_api_key_user_id/team_id: who made the request - a specific user or a groupmetadata.user_api_key_user_id / team_id:谁发起的请求 — 特定用户或组metadata.requester_ip_address: the client's addressmetadata.requester_ip_address:客户端地址
Rate limits from the provider (in hidden_params), see Rate Limit Headers:来自提供商的速率限制(在 hidden_params 中),参见“速率限制头”:
x_ratelimit_remaining_requests: how many requests are left before the provider starts returning a 429 - Too Many Requests errorx_ratelimit_remaining_requests:在提供商开始返回 429 - Too Many Requests 错误之前,还剩下多少请求额度x_ratelimit_remaining_tokens: the same, but for tokensx_ratelimit_remaining_tokens:同上,但针对 Token
Content (may contain sensitive data, can be disabled, see Redacting Messages, Response Content and Capturing Message Content):内容(可能包含敏感数据,可禁用,参见“编辑消息、响应内容和捕获消息内容”):
gen_ai.input.messages: the prompt itselfgen_ai.input.messages:提示词本身gen_ai.output.messages: the model's responsegen_ai.output.messages:模型响应
Request status:请求状态:
status_code: 1 - OK (2 = ERROR)status_code:1 - OK (2 = ERROR)gen_ai.response.finish_reasons: why the generation stoppedgen_ai.response.finish_reasons:生成停止的原因
Access Management
The core concept — we can have different Organizations (but that’s an Enterprise feature), each Organization can contain several Teams, in each Team we keep Users, and each User can create their own API Keys — see User Management Hierarchy.核心概念 — 我们可以有不同的组织(但这是企业版功能),每个组织可以包含多个团队,在每个团队中我们管理用户,每个用户可以创建自己的 API 密钥 — 参见“用户管理层级”。
Users log into the Web UI or the API, and we use API Keys for services.用户登录 Web UI 或 API,我们为服务使用 API 密钥。
Authentication and access
The main method is API Keys for services or users that work with LiteLLM through the API — and there are regular passwords for users who use the Web UI.主要方法是为通过 API 使用 LiteLLM 的服务或用户提供 API 密钥,而使用 Web UI 的用户则有常规密码。
There’s support for authentication with JWT — but that’s an Enterprise feature.支持 JWT 身份验证 — 但这是企业版功能。
Out of the box we have SSO — “SSO is now Free for up to 5 users”, more users only in Enterprise, see SSO for Admin UI.开箱即用支持 SSO — “SSO 现在对最多 5 个用户免费”,更多用户仅限企业版,参见“Admin UI 的 SSO”。
There’s even support for User Provisioning with SCIM (see Okta: integration with Google Workspaces, part 1 — Provisioning) — but here too it’s Premium.甚至支持使用 SCIM 进行用户配置(参见《Okta:与 Google Workspaces 集成,第 1 部分 — 配置》) — 但这里也是高级功能。
That said, we can automate this with litellm-operator — maybe I’ll give it a try, but I’m not sure, since the operator is unofficial.话虽如此,我们可以用 litellm-operator 自动化这一点 — 也许我会尝试一下,但我不确定,因为该 Operator 是非官方的。
And a really neat thing — IP restrictions, see IP Address Filtering — but again an Enterprise feature :-(还有一个非常整洁的功能 — IP 限制,参见“IP 地址过滤” — 但同样是企业版功能 :(
So, of the Free options we’re left with just Teams, users and API Keys.所以,在免费选项中,我们只剩下团队、用户和 API 密钥。
Teams and Users
For each Team you can configure which models from model_list that group's users and keys will have access to, the maximum Costs budget the group can spend per day/week/month, and you can set limits on Tokens per minute Limit (TPM) and Requests per minute Limit (RPM) - see Budgets, Rate Limits and Setting Team Budgets.对于每个团队,你可以配置该组用户和密钥可以访问 model_list 中的哪些模型,该组每天/每周/每月可以花费的最大成本预算,并且你可以设置每分钟 Token 限额(TPM)和每分钟请求限额(RPM) - 参见“预算、速率限制和设置团队预算”。
Besides that, there are Access Groups — we group lists of models, MCP or agents into a single list that can then be attached to Teams or Users.此外还有访问组(Access Groups) — 我们将模型、MCP 或 Agent 列表组合成一个列表,然后可以将其附加到团队或用户。
And in monitoring, as we saw above, we have attributes with group and user names — so later we can build charts and alerts based on them.在监控方面,正如我们上面看到的,我们有带有组名和用户名的属性 — 因此稍后我们可以基于它们构建图表和告警。
Besides regular users, we can have Service Accounts.除了普通用户,我们还可以有服务账户(Service Accounts)。
Budgets and limits
Budgets and Tokens/Requests Per Minute limits can be set at the level of the whole Gateway, at the Team level, for each user in that Team, or on individual users outside a Team or on specific API Keys.预算和每分钟 Token/请求限额可以在整个网关级别、团队级别、该团队中的每个用户级别,或者团队之外的单个用户或特定 API 密钥上设置。
But here there’s one thing that’s a bit odd, in my view:但这里有一点在我看来有点奇怪:
- Team Limits only apply to the API Keys that were explicitly created by a user or admin for that group (they have a
team_id)团队限额仅适用于由用户或管理员明确为该组创建的 API 密钥(它们具有 team_id) - meanwhile a User with a Global Proxy Role == Internal User (Create/Delete/View) can create their own keys (not tied to a Team), not set any limits on them — and happily spam the LLM with requests同时,具有 Global Proxy Role == Internal User (Create/Delete/View) 的用户可以创建自己的密钥(不绑定到团队),不对其设置任何限制 — 并愉快地向 LLM 发送垃圾请求
- the only restriction we can set in the Web UI when creating a new user is which models will be available to them (although the API docs for
/user/newhavemax_budget,rpm_limitandtpm_limitparameters - there'll be an example below)我们在 Web UI 中创建新用户时唯一能设置的限制是他们可以访问哪些模型(尽管 /user/new 的 API 文档有 max_budget、rpm_limit 和 tpm_limit 参数 - 下面会有示例)
That is, on one hand — there’s supposedly a User who’s a member of a Team, and in the Team we set, say, a Team Member RPM Limit — but at the same time this user can create keys that this limit doesn’t affect at all.也就是说,一方面,有一个作为团队成员的用户,我们在团队中设置了,比如,团队成员 RPM 限额 — 但同时该用户可以创建完全不受此限额影响的密钥。
And the only restriction we can set when creating a user in the Web UI is which models will be available to them — although through the config file you can also set upperbound_key_generate_params, see All Settings for Self Serve.我们在 Web UI 中创建用户时唯一能设置的限制是他们可以访问哪些模型 — 尽管通过配置文件你也可以设置 upperbound_key_generate_params,参见“自助服务的所有设置”。
It looks like the UI just doesn’t have all the options yet that are available in the API.看起来 UI 还没有包含 API 中提供的所有选项。
In general, I’ll probably need to write a separate post on the topic of access and limits, because here “it’s not all that clear-cut”.总的来说,我可能需要就访问和限额这个话题写一篇单独的文章,因为这里“并非一切都那么明确”。
RBAC and System Roles
Pretty simple (at least for now, in version v1.82.6), with a few default roles — but there’s RBAC.非常简单(至少目前在 v1.82.6 版本中是这样),有几个默认角色 — 但有 RBAC。
The roles are split into three main groups:角色分为三个主要组:
- global ones for all of LiteLLM —
adminandadmin_read_only适用于所有 LiteLLM 的全局角色 — admin 和 admin_read_only - user roles —
useranduser_read_only用户角色 — user 和 user_read_only - Organization and Team Roles — org/team admin组织和团队角色 — org/team admin
See User Roles and Available Roles.参见“用户角色”和“可用角色”。
Alright, let’s look at how all this works in practice: we’ll create a Team with a budget and Requests per minute limits, then add a user to that group, create an API Key for the user — and use it in our Demo App.好了,让我们看看这一切在实践中是如何工作的:我们将创建一个带有预算和每分钟请求限额的团队,然后将一个用户添加到该组,为该用户创建一个 API 密钥 — 并在我们的演示应用中使用它。
Creating a Team
We go to Teams > Create Team:我们进入 Teams > Create Team:
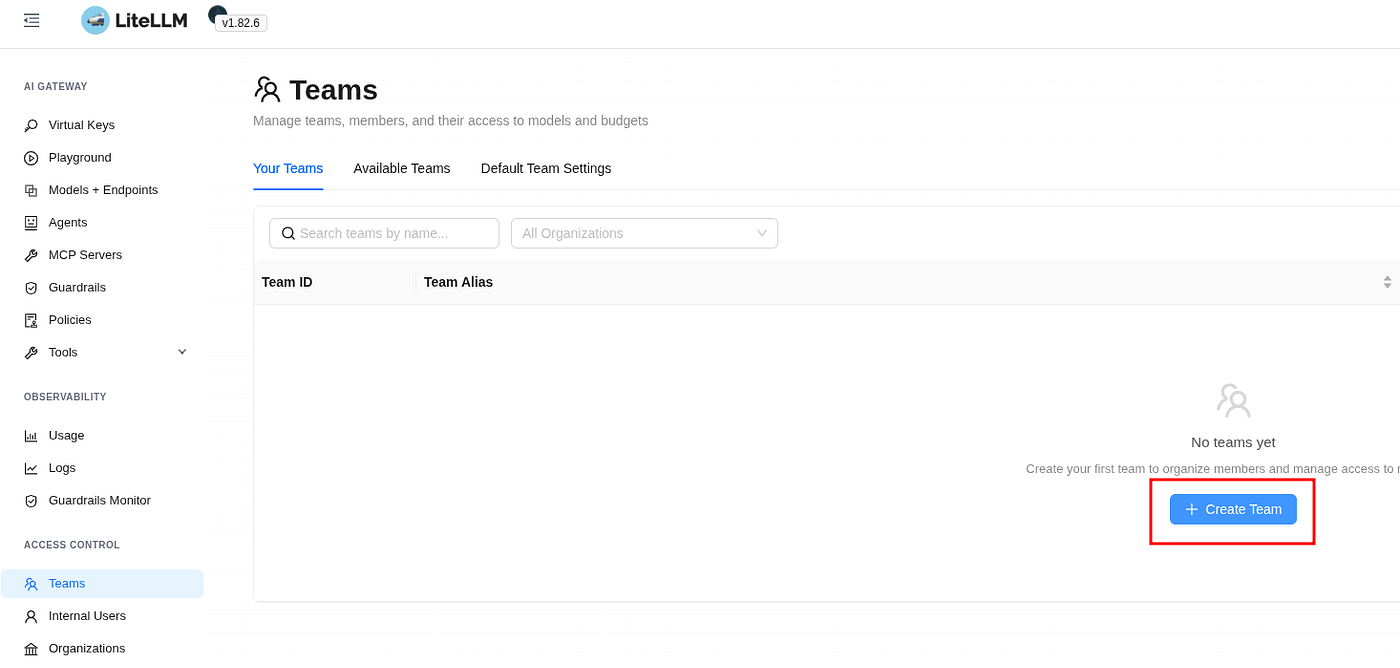
We create the group:我们创建该组:
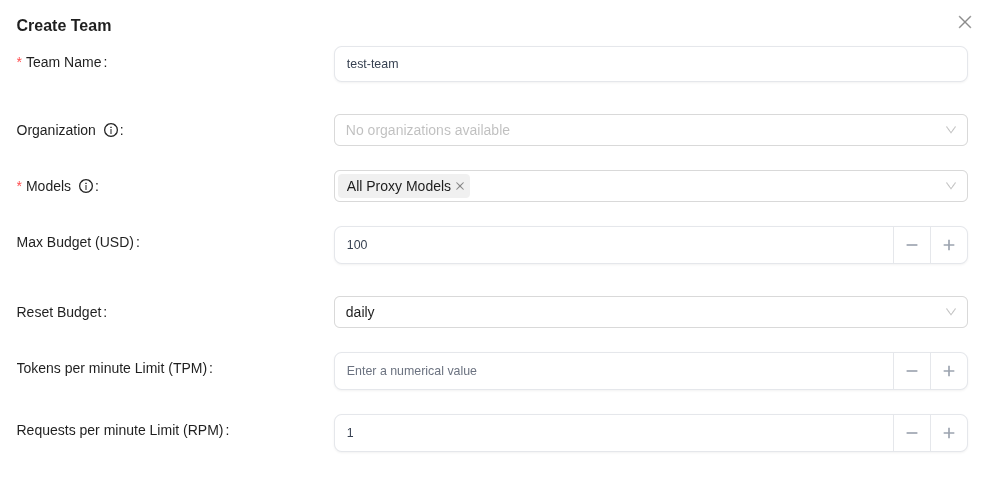
Here we grant access to all models, set a total group budget of 100 dollars per day (Reset Budget: daily), and to test things we set a hard limit of 1 request per minute.在这里我们授予对所有模型的访问权限,设置每天 100 美元的组总预算(重置预算:每日),为了测试,我们设置了每分钟 1 个请求的硬性限制。
Budgets and limits in a Team are set on two “levels” — the group itself and all the users in it, and separately for each user (more precisely — their keys created in this group — see below), that is:团队中的预算和限额是在两个“级别”上设置的 — 组本身及其所有用户,以及每个用户(更准确地说是他们在该组中创建的密钥 — 见下文),即:
- Max Budget (USD): this is the budget for everyone together, while Team Member Budget (USD) — is for each user in the groupMax Budget (USD):这是所有人共同的预算,而 Team Member Budget (USD) — 是针对组中每个用户的
- Requests per minute Limit (RPM): for the whole Team, while Team Member RPM Limit — is for each user in the groupRequests per minute Limit (RPM):针对整个团队,而 Team Member RPM Limit — 是针对组中每个用户的
Budgets are created as separate objects, available under Budgets:预算作为独立对象创建,可在 Budgets 下找到:
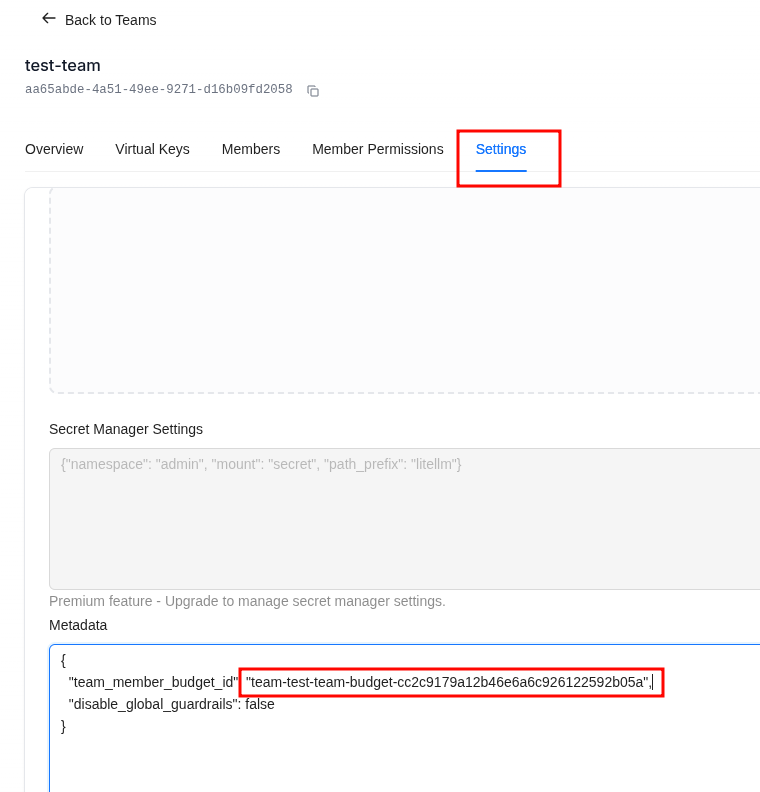
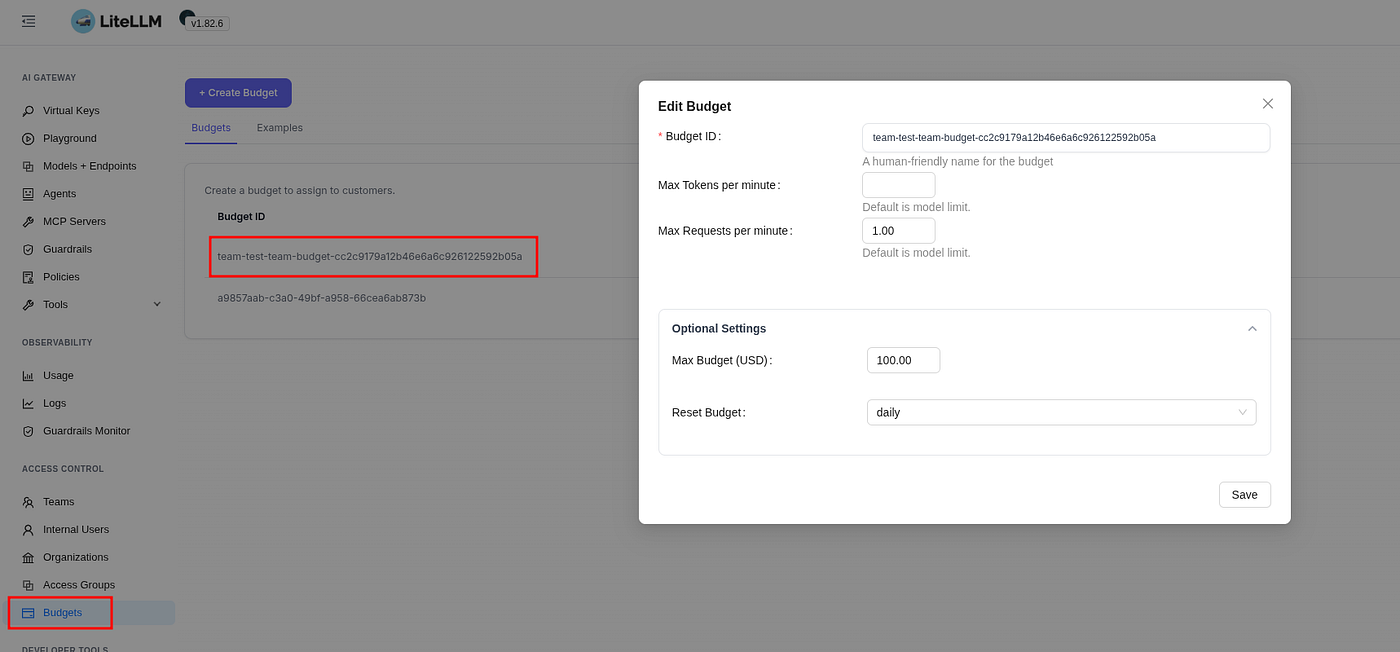
And here I caught yet another thing, either a bug or a feature, that after changing the values in Team Budget the budget values for the user didn’t change until I did it by hand right in Budgets.在这里我又发现了一个问题,不管是 Bug 还是特性,在更改团队预算值后,用户的预算值并没有改变,直到我在 Budgets 中手动操作。
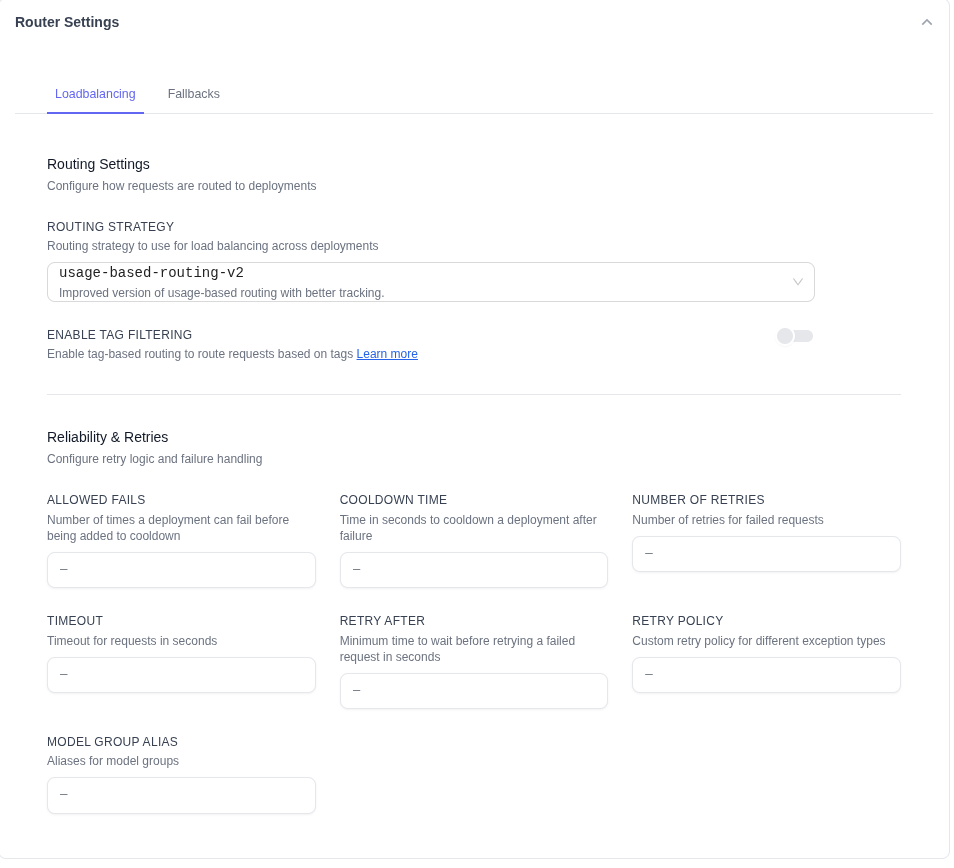
Lower down in the new Team’s parameters, under Router Settings, you can configure your own parameters for Load Balancing and Fallbacks:在新团队参数的下方,在 Router Settings 下,你可以配置自己的负载均衡和故障转移参数:
Creating a User in the Web UI
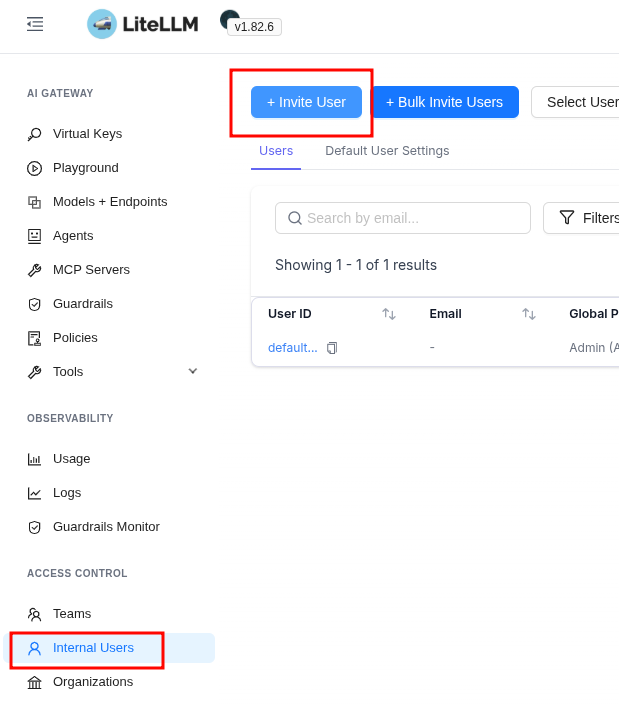
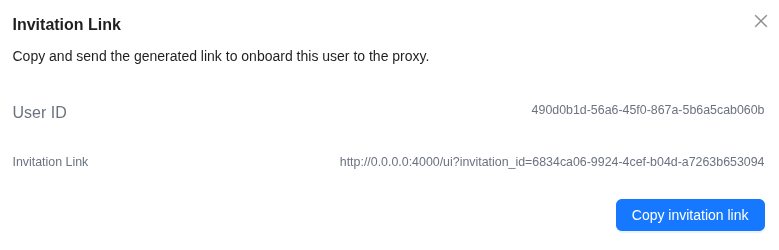
Users in the UI are created via an Invite that’s sent to an email — so you need to have SMTP, but after creating the Invite we’ll be shown a link we can register with.UI 中的用户通过发送到电子邮件的邀请创建 — 因此你需要有 SMTP,但在创建邀请后,我们将看到一个可以注册的链接。
We click Invite User:我们点击 Invite User:
We assign a role with rights to create keys, pick the group we created above, in Personal Key Creation you can restrict access to models — and that’s, in fact, the only restriction we can set for the user here:我们分配一个有权创建密钥的角色,选择我们上面创建的组,在 Personal Key Creation 中你可以限制对模型的访问 — 这实际上是我们在这里能为用户设置的唯一限制:
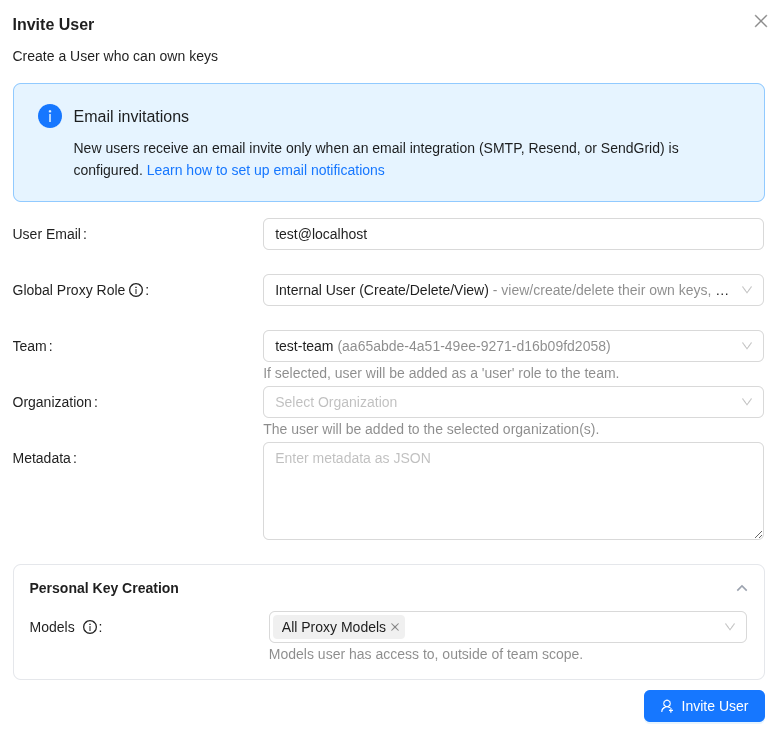
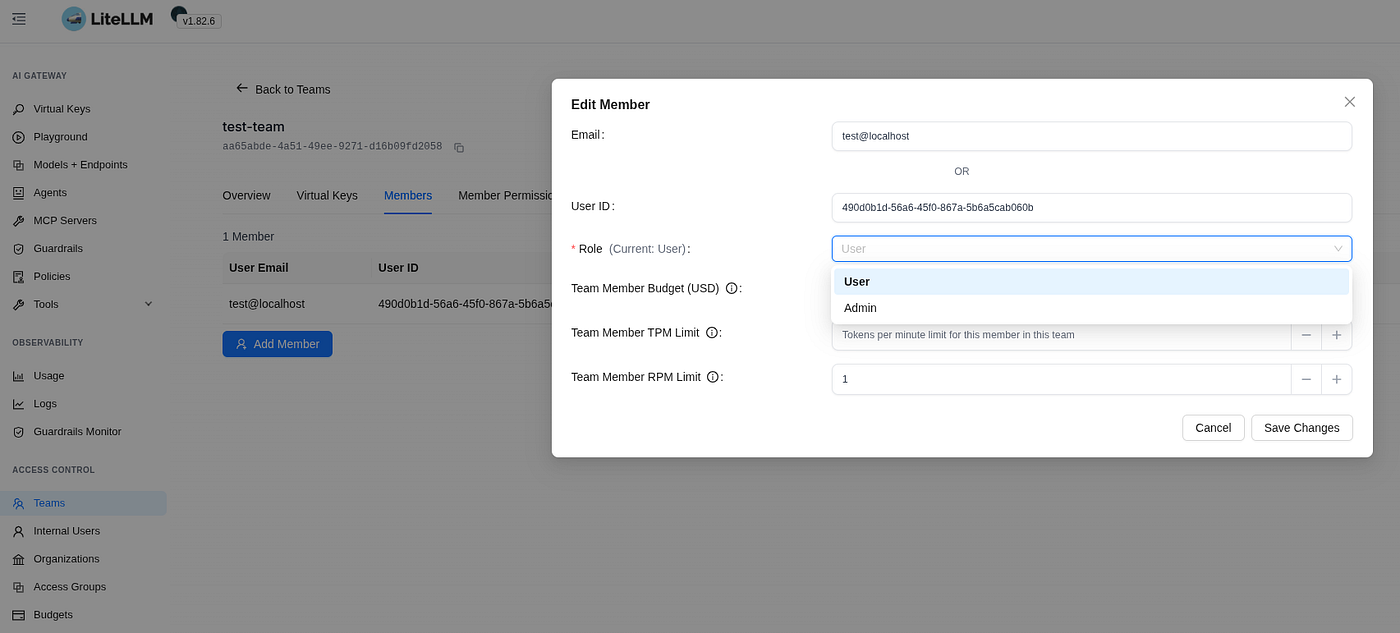
What’s more: while creating a user in a Team — you can’t assign them a Team Role right away, and they’ll be created with the default User role — but that can be changed later.更重要的是:在团队中创建用户时 — 你不能立即为他们分配团队角色,他们将以默认的用户角色创建 — 但这以后可以更改。
We click Invite User — and get the link that was sent to the email:我们点击 Invite User — 并获得发送到电子邮件的链接:
We open it in Incognito, set the new user’s password, and land in the Web UI — but here, of course, there’s a lot less access:我们在无痕模式下打开它,设置新用户的密码,并进入 Web UI — 但在这里,当然,访问权限少了很多:
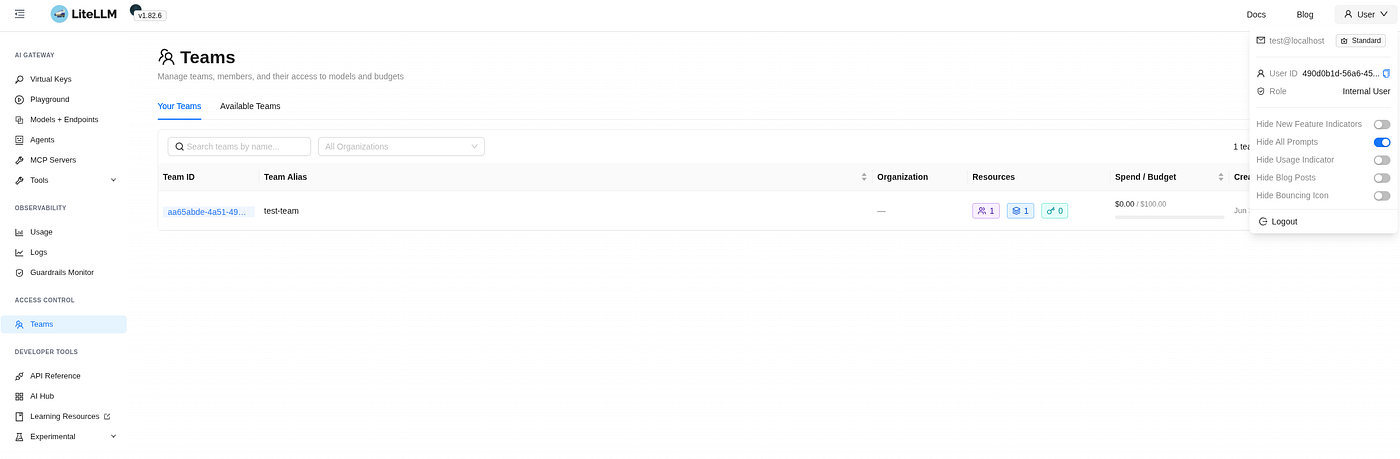
Team Permissions
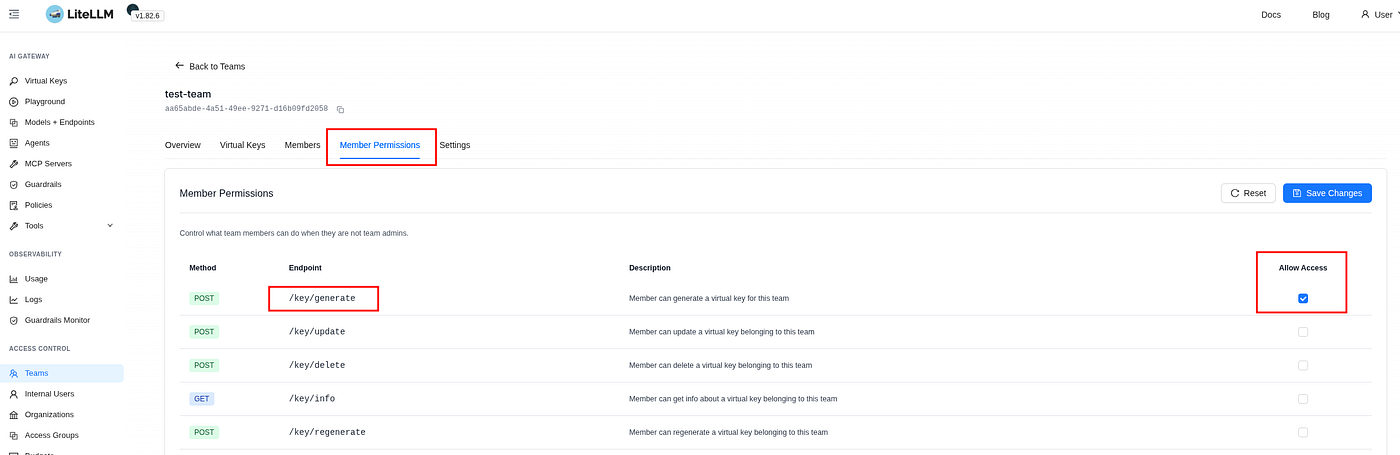
Already after the invite we can change the user’s role in this group — because without the Admin role they won’t be able to create keys in the group, or even set their own Member Limits/Budget:在邀请之后,我们就可以更改用户在该组中的角色 — 因为没有管理员角色,他们将无法在该组中创建密钥,甚至无法设置自己的成员限额/预算:
Another way to allow creating keys for the group — set it via Member Permissions:允许为该组创建密钥的另一种方法 — 通过 Member Permissions 设置:
Creating a User API Key for a Team in the Web UI
Now under this user we create a key — we specify the group but don’t set an RPM:现在在该用户下,我们创建一个密钥 — 我们指定该组但不设置 RPM:
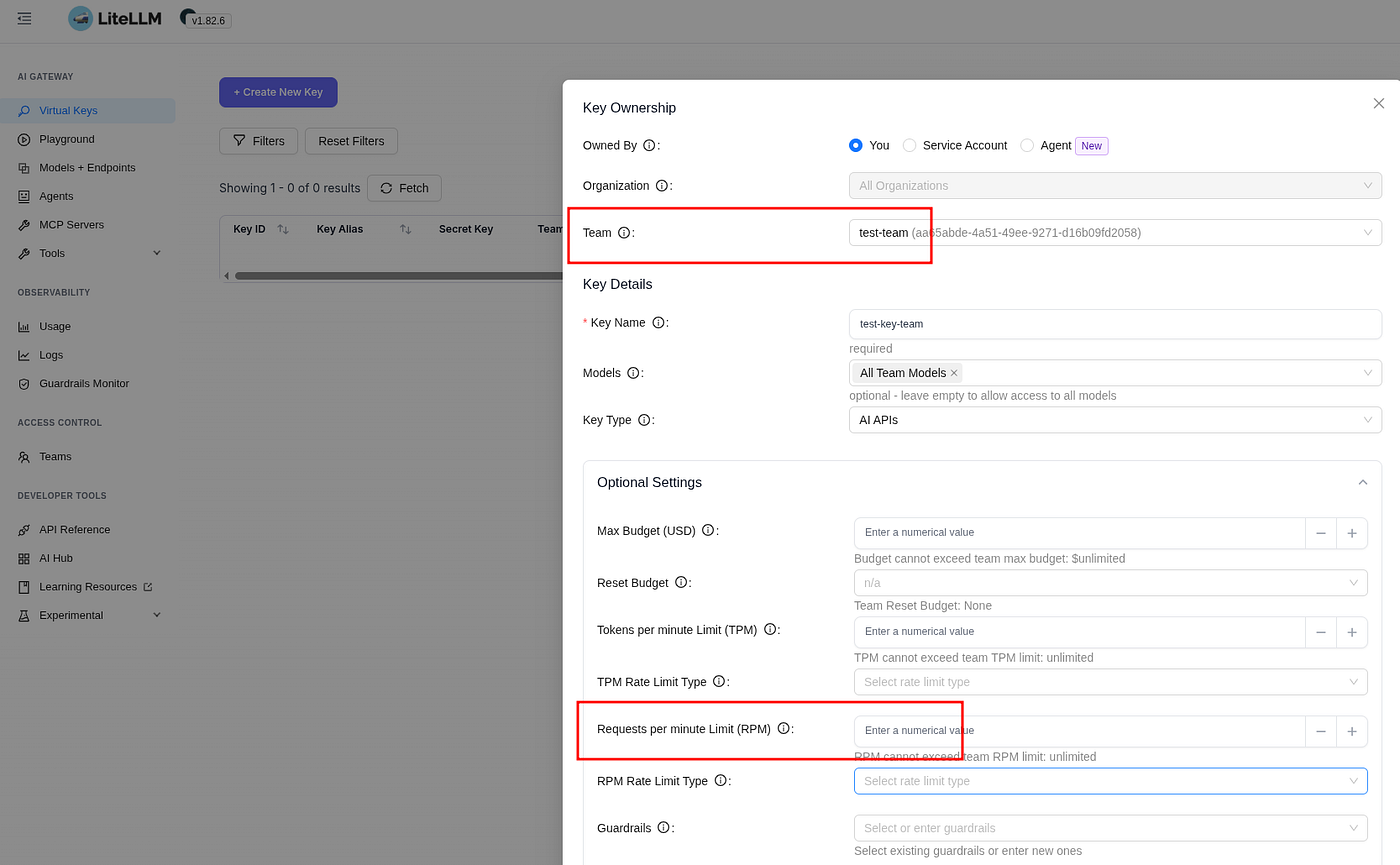
We save the key:我们保存密钥:
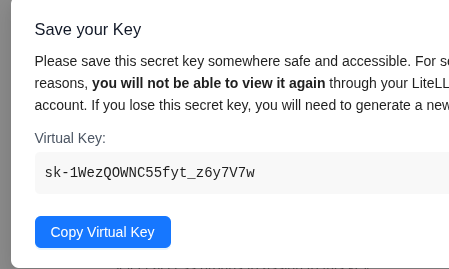
We set a new variable:我们设置一个新变量:
$ export LITELLM_USER_KEY=sk-1WezQOWNC55fyt_z6y7V7wIn the Demo App code we change the variable name from LITELLM_MASTER_KEY to LITELLM_USER_KEY, and we can add max_retries - so we catch the Exception right away when LiteLLM returns a 429 to the client:在演示应用代码中,我们将变量名从 LITELLM_MASTER_KEY 更改为 LITELLM_USER_KEY,并且可以添加 max_retries — 这样当 LiteLLM 向客户端返回 429 时,我们可以立即捕获异常:
...

client = OpenAI(
    base_url="http://localhost:4000",
    api_key=os.getenv("LITELLM_USER_KEY"),
    max_retries=0,
)

...
We run the script twice in a row — the first one worked, but the second time we catch a 429 Rate limit exceeded — because we set the RPM Limit in the Team:我们连续运行两次脚本 — 第一次成功了,但第二次我们捕获到了 429 Rate limit exceeded — 因为我们在团队中设置了 RPM 限额:
 $ ./demo-llm.py
Hello! How can I assist you today?
...

$ ./demo-llm.py
...
openai.RateLimitError: Error code: 429 - {'error': {'message': 'Rate limit exceeded for team: aa65abde-4a51-49ee-9271-d16b09fd2058. Limit type: requests. Current limit: 1, Remaining: 0. Limit resets at: 2026-06-04 09:13:21 UTC', 'type': 'None', 'param': 'None', 'code': '429'}}
Creating a User API Key in the Web UI without a Team and without Limits
Now under the same user we create one more key — but this time without a Team, and again we don’t set any limits:现在在同一个用户下,我们再创建一个密钥 — 但这次不带团队,同样我们不设置任何限制:
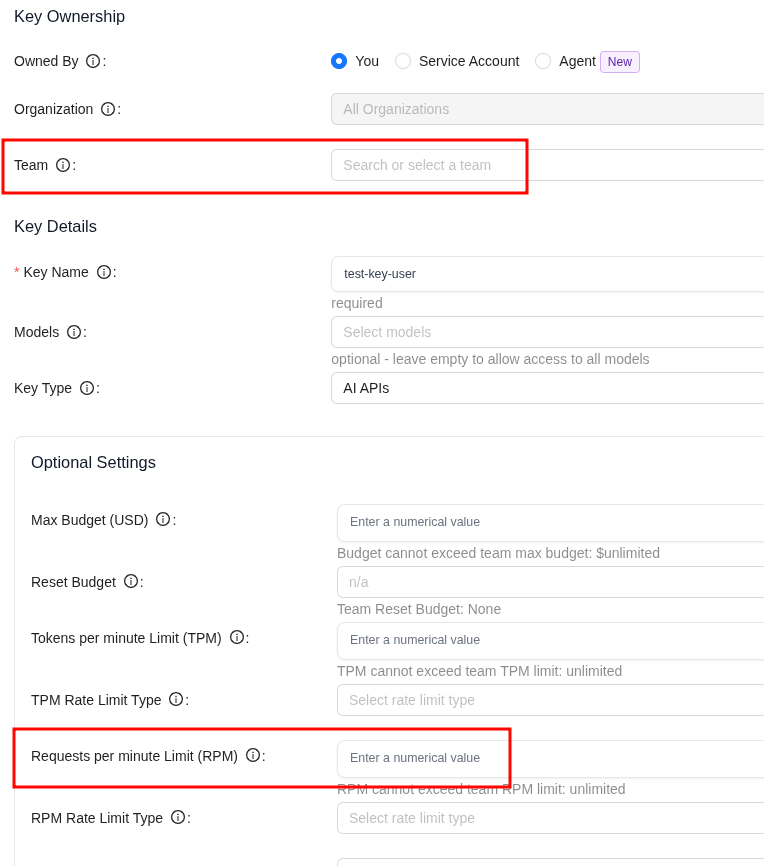
We update the variable:我们更新变量:
$ export LITELLM_USER_KEY=sk-K7Dvc7gSFye6RKsFBB2PyQWe run the script — and happily spam LiteLLM with requests:我们运行脚本 — 并愉快地向 LiteLLM 发送垃圾请求:
$ ./demo-llm.py
Hello! How can I assist you today?
...
$ ./demo-llm.py
Hello! How can I assist you today?
...That is, if we give users the ability to create keys — they can calmly make keys without any restrictions (apart from the ones we set globally in upperbound_key_generate_params).也就是说,如果我们赋予用户创建密钥的能力 — 他们可以从容地制作没有任何限制的密钥(除了我们在 upperbound_key_generate_params 中全局设置的限制)。
But when creating a user or a key through the API we can set all the needed limits right away.但通过 API 创建用户或密钥时,我们可以立即设置所有必要的限额。
Creating a User and API Key via the LiteLLM API with a Rate Limit
See LiteLLM API /user/new.参见 LiteLLM API /user/new。
We create a user with an rpm_limit:我们创建一个带有 rpm_limit 的用户:
$ curl -X POST http://localhost:4000/user/new \
-H "Authorization: Bearer $LITELLM_MASTER_KEY" \
-H "Content-Type: application/json" \
-d '{
"user_email": "test-rpm@test.com",
"rpm_limit": 1,
"user_role": "internal_user"
}'In the response we get their key, and right there we see that team_id is empty - the user doesn't belong to a group, but has their own rpm_limit:在响应中我们得到了他们的密钥,并且就在那里我们看到 team_id 为空 - 该用户不属于任何组,但有自己的 rpm_limit:
{..., "max_budget":null, "user_id":"7a9a6ced-ae6a-497e-a9ba-e35825139845", "team_id":null, ..., "rpm_limit":1, ..., "key":"sk-cazziUlsSKQEGTsTUGILRA", ... ,"user_email":"test-rpm@test.com","user_role":"internal_user", ... }We set this key in a variable:我们将此密钥设置为变量:
$ export LITELLM_USER_KEY=sk-cazziUlsSKQEGTsTUGILRAWe run the script twice — and on the second one we get a 429 again:我们运行脚本两次 — 第二次我们又得到了 429:
$ ./demo-llm.py
Hello! How can I assist you today?
...$ ./demo-llm.py
...
openai.RateLimitError: Error code: 429 - {'error': {'message': 'Rate limit exceeded [...] }Instead of conclusions
The system looks really cool in terms of letting you have unified LLM monitoring — out of the box we get a bunch of useful metrics, we get traces. And 50,000 stars on GitHub isn’t something just anyone racks up.这个系统在实现统一的大模型(LLM)监控方面看起来真的很棒——开箱即用,我们就能获得大量有用的指标和追踪数据。毕竟,能在 GitHub 上获得 5 万颗星可不是随便谁都能做到的。
The traces integrate beautifully with external systems, and it’s really convenient that out of the box we can send them to several different backends at once.这些追踪数据与外部系统的集成非常完美,而且它支持开箱即用,能同时将数据发送到多个不同的后端,这确实非常方便。
But the user management raised some questions for me — because it’s somehow not very intuitive. In places, at first glance, confusing, in places with something that looks like bugs. Although overall there really are a lot of access management capabilities.但用户管理功能让我产生了一些疑问,因为它显得不太直观。有些地方乍看之下令人困惑,甚至看起来像是存在 bug。不过总的来说,它的访问管理功能确实非常丰富。
Still, let’s try running it on our side and see how it does in real work — luckily, when the project is at MVP you can afford to experiment.尽管如此,我们还是打算在自己的环境中运行一下,看看它在实际工作中的表现如何——好在项目处于 MVP 阶段时,我们还有资本进行尝试。
And when I run it in Kubernetes — I’ll probably go through the access and users separately one more time, because this needs some extra digging.等我在 Kubernetes 中运行它时,我可能会再专门研究一遍访问权限和用户管理,因为这部分确实需要深入挖掘。
Originally published at RTFM: Linux, DevOps, and system administration.原文发布于 RTFM:Linux、DevOps 与系统管理。


