Anomaly detection using dynamic thresholds and two-year-long alerts in Cloud Monitoring在 Cloud Monitoring 中使用动态阈值和两年期告警进行异常检测
Lee YancoLee Yanco
Senior Product Manager高级产品经理
Daniel KossDaniel Koss
Staff Software Engineer高级软件工程师
Try Gemini Enterprise Business Edition today立即试用 Gemini Enterprise 商业版
The front door to AI in the workplaceAI 进入工作场所的门户
Try now 立即试用Choosing the threshold of an alert policy can be a headache. You have to analyze historical data, aggregate it into semantically meaningful time series, and choose a threshold that matters. If the workload grows, your previously set static threshold might become too low, and your alert might fire too frequently. New workloads might require setting new thresholds, and setting separate thresholds for separate workloads requires creating separate policies, resulting in the annoyance of managing a fleet of mostly similar policies.选择告警策略的阈值可能很令人头疼。你需要分析历史数据,将其聚合成语义上有意义的时间序列,然后选择一个有意义的阈值。如果工作负载增长,之前设置的静态阈值可能会变得过低,导致告警触发过于频繁。新的工作负载可能需要设置新的阈值,而为不同的工作负载分别设置阈值需要创建不同的策略,从而造成管理大量类似策略的麻烦。
Not to mention, some metrics can’t even be alerted on using static thresholds. If your metric varies by time of day, like many e-commerce metrics do, then no single threshold will work. For example, what do you do if your metric looks like this:更不用说,有些指标甚至无法使用静态阈值进行告警。如果您的指标随时间变化,就像许多电子商务指标一样,那么单一的阈值将无法发挥作用。例如,如果您的指标如下所示,您该怎么办:
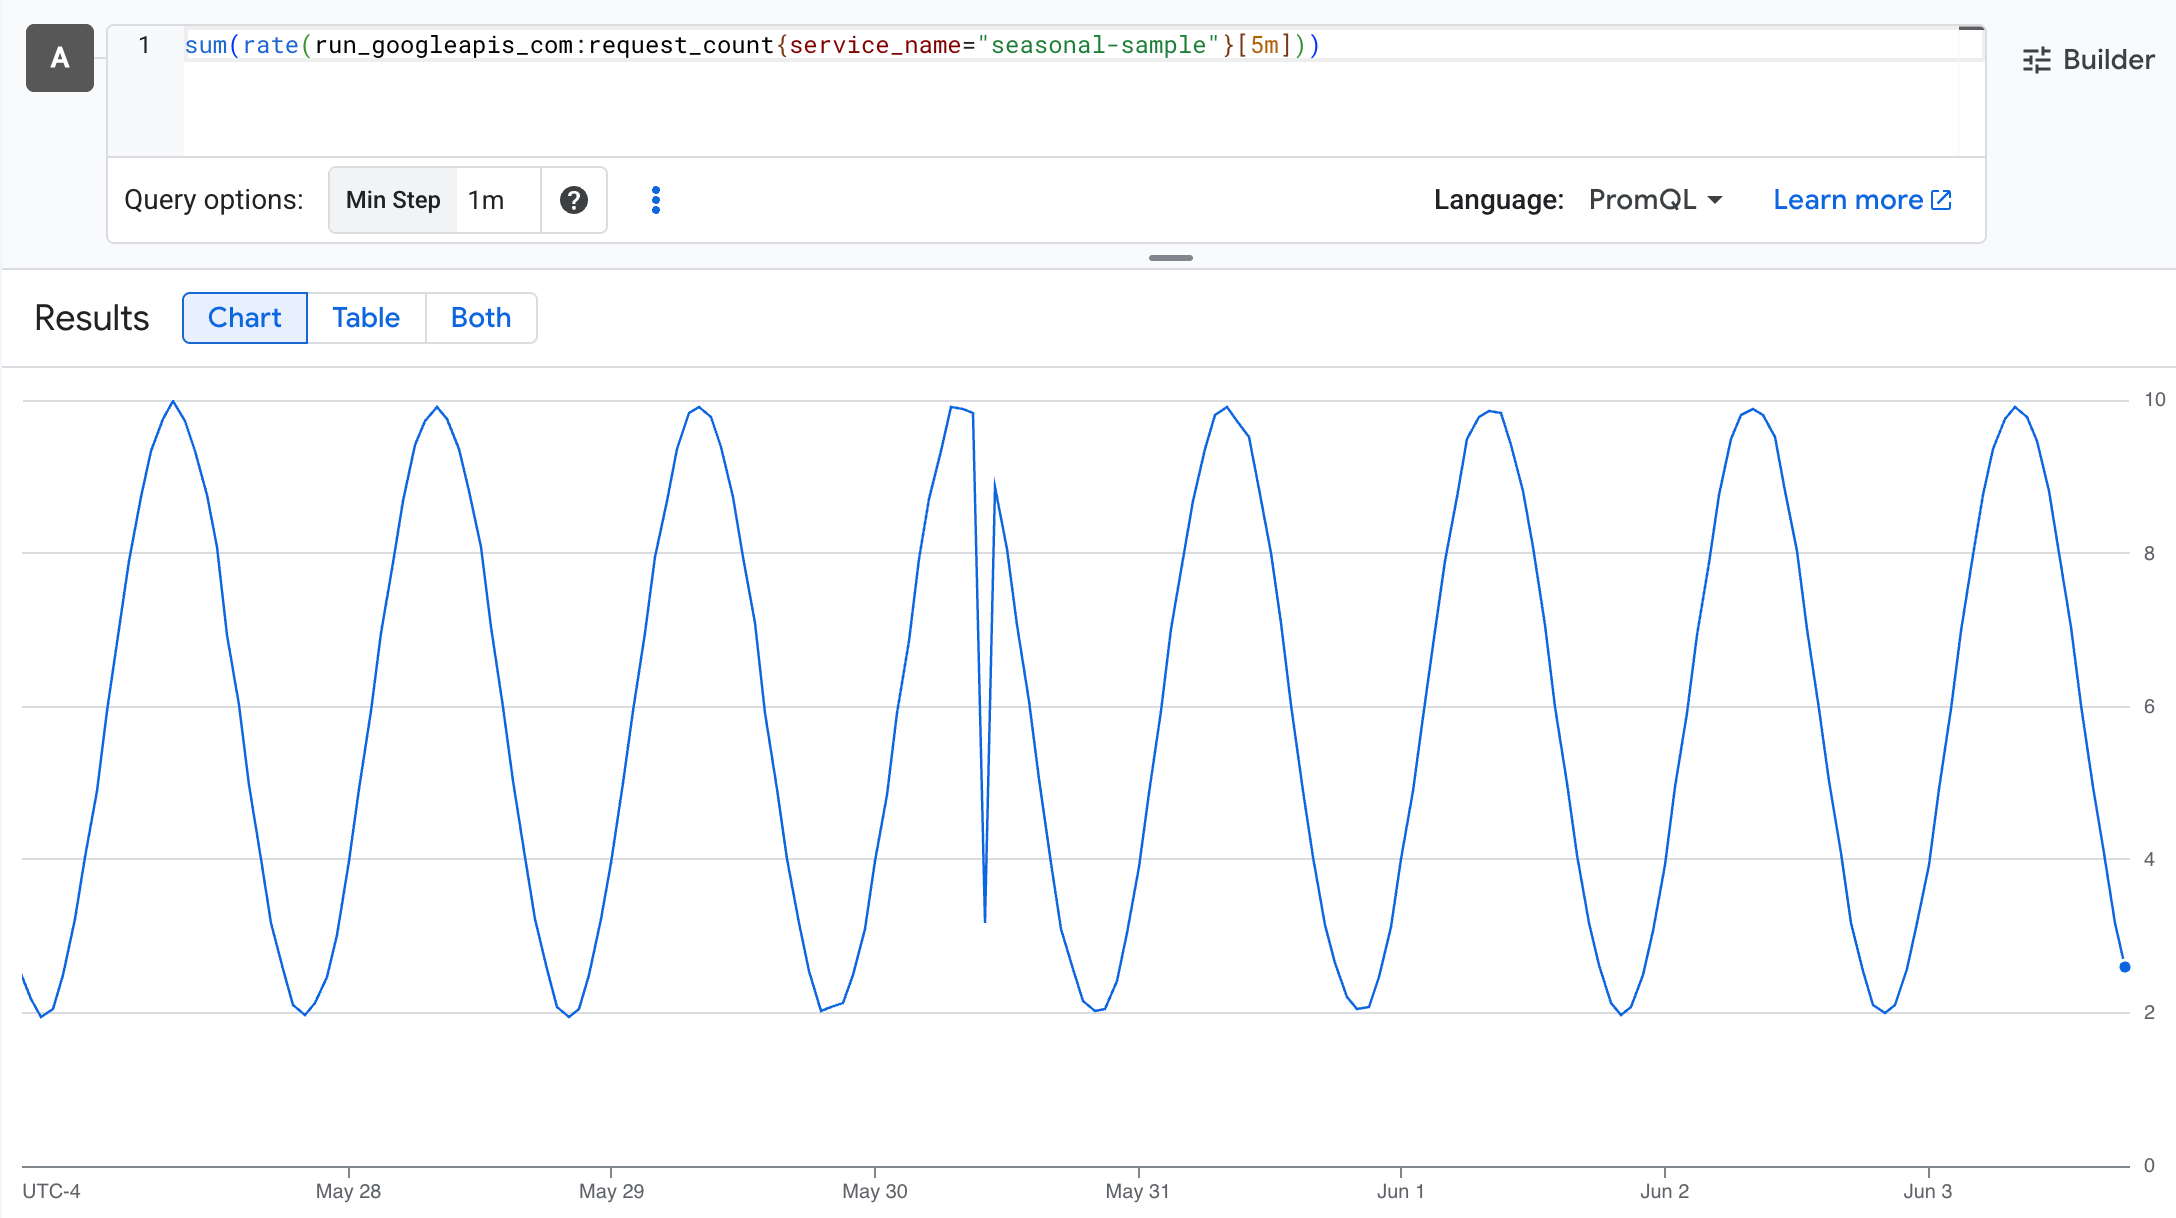
Clearly something went wrong in the middle of that chart… but because the anomalous value is within the normal range of the daily data, no static value threshold can ever catch it.很明显,该图中间某处出了问题……但由于异常值在每日数据的正常范围内,任何静态值阈值都无法捕捉到它。
Introducing long lookbacks and dynamic thresholding引入长期回顾和动态阈值
We are pleased to announce that this problem is now solvable for users of Cloud Monitoring alerts with the launch of long-lookback alert policies for PromQL, currently in preview. This highly requested feature update now lets you configure PromQL alert policies to run over two years of metric data stored in Cloud Monitoring, supporting year-over-year and quarter-over-quarter analysis. 我们很高兴地宣布,通过推出 PromQL 的长期回顾告警策略(目前处于预览阶段),Cloud Monitoring 告警用户现在可以解决这个问题。这项备受期待的功能更新现在允许您配置 PromQL 告警策略,使其对 Cloud Monitoring 中存储的超过两年的指标数据进行运行,支持同比和环比分析。
One major use case unlocked by two-year lookback horizons in PromQL is dynamic thresholding, that is, policies where the threshold refers to the metric’s history. A simple example is an alert policy that says “alert me if the average over the last 5 minutes is 2x more than the average over the last week.” Instead of setting a static number as your threshold, you set how anomalous each time series must be from its historical data before generating an alert. This allows flexibility in policies, supports naturally changing baselines caused by growth in workloads, and provides a single threshold that works for all workloads. You don’t have to analyze every time series to set alerts properly – just set a factor that signals “anomalous” to you.PromQL 中两年回顾窗口解锁的一个主要用例是动态阈值,即阈值参考指标历史数据的策略。一个简单的例子是告警策略:'如果最近 5 分钟的平均值超过最近一周平均值的 2 倍,则告警我。' 您无需设置静态数字作为阈值,而是设置每个时间序列相对于其历史数据的异常程度才能生成告警。这使策略具有灵活性,支持工作负载增长导致的自然基线变化,并为所有工作负载提供统一的阈值。您无需分析每个时间序列即可正确设置告警——只需设置一个对您而言表示'异常'的因子即可。
Take the above example: To catch that anomaly, you might create a policy that says “alert me if the value over the last 5 minutes is lower than 70% of the value from the same 5-minute span one week ago.” Such a policy would create a threshold that varies by the time of day, and you would catch the anomalous drop:以上面的例子为例:为了捕捉该异常,您可以创建一个策略:'如果最近 5 分钟的值低于一周前同一 5 分钟时段值的 70%,则告警我。' 这样的策略将创建一个随时间变化的阈值,您将捕捉到异常下降:

Dynamic threshold algorithms动态阈值算法
Choosing the right dynamic threshold algorithm in PromQL depends on the shape of your source data. Metrics that vary by time of day need a different algorithm than metrics that have little variation. 在 PromQL 中选择合适的动态阈值算法取决于源数据的形态。随时间变化的指标与变化较小的指标需要不同的算法。
You can rewrite the below examples to have the historical data query as your threshold (putting a metric after the < or >), but if you do so you can’t easily visualize the threshold.您可以将下面的示例重写为将历史数据查询作为阈值(在 < 或 > 后面放置指标),但如果这样做,您将无法轻松可视化阈值。
Because these use historical data, granular alert policies that trigger on individual workloads instead of aggregates might be flaky when spinning up new workloads. This issue will resolve itself as you accrue historical data. You can also avoid this by only running dynamic threshold alerts on aggregates.由于这些使用历史数据,针对单个工作负载(而非聚合)触发的细粒度告警策略在启动新工作负载时可能会不稳定。随着您积累历史数据,此问题将自行解决。您也可以仅对聚合运行动态阈值告警来避免此问题。
Moving averages
In the simplest of the algorithms, alerts trigger when the recent trend of the data deviates from a moving average of data over a long period of time. This is good for catching anomalies in relatively stable data. 移动平均线在最简单的算法中,当数据的近期趋势偏离长时间内的数据移动平均值时,会触发告警。这适用于捕捉相对稳定数据中的异常。
Here’s some example PromQL, comparing the last 5 minutes to a one-week baseline and alerting if it’s 30% higher or lower than average:以下是一些示例 PromQL,将最近 5 分钟与一周基线进行比较,如果比平均值高或低 30%,则发出告警:
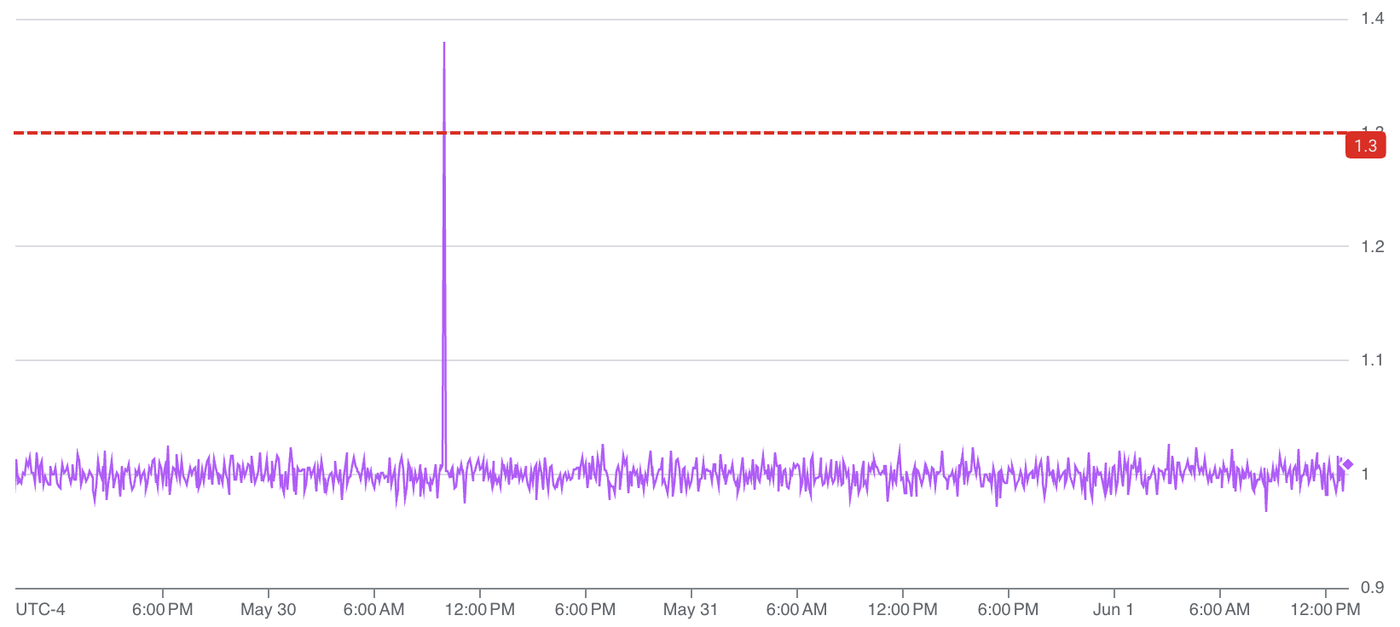
You can also write this as a direct comparison, which might be more understandable. The following says “alert me if the most recent 5 minutes average of data is >1.3x the weekly average.”:您也可以将其编写为直接比较,这样可能更容易理解。以下表示:'如果最近 5 分钟的数据平均值大于周平均值的 1.3 倍,则告警我。':
Z-score (standard deviation)
Use this algorithm to identify anomalies based on the average and standard deviation of your data. A z-score measures the statistical distance between your recent data and historical data, with a common threshold being that a z-score above three or below negative three is considered anomalous. This measures the volatility of your data compared to its usual noisiness, and it works best with data that has a stable average and decent volatility:Z 分数(标准差)使用此算法根据数据的平均值和标准差来识别异常。Z 分数衡量近期数据与历史数据之间的统计距离,常见阈值为 Z 分数高于三或低于负三被视为异常。这衡量的是数据相对于其通常噪声的波动性,并且最适合具有稳定平均值和适当波动性的数据:
Example PromQL, comparing the last 5 minutes to the one-week average and standard deviation:示例 PromQL,比较最近 5 分钟与一周平均值和标准差:
Example z-score signal and the resulting anomaly detection threshold:示例 Z 分数信号及由此产生的异常检测阈值:

Seasonal decomposition (time offset comparison)
This is a simple time-offset algorithm that compares time-series data in a period of time to the same period from the previous day or week. This is ideal for metrics that have timely patterns associated with them, such as visitors to a website that vary by time of day and day of week. Holidays and other factors that might cause a given day to be lower than expected can be smoothed away by averaging more than one historical period (e.g., average one week ago, two weeks ago, and three weeks ago, then compare that average to today).季节性分解(时间偏移比较)这是一种简单的时间偏移算法,将一段时间的时间序列数据与前一天或前一周的同一时间段进行比较。这非常适合具有时间模式的指标,例如随时间变化和星期几变化的网站访问者。节假日和其他可能导致某一天低于预期的因素可以通过对多个历史时期取平均值来平滑(例如,平均一周前、两周前和三周前,然后将该平均值与今天进行比较)。
Example PromQL, comparing the last 5 minutes to the same time period yesterday, alerting if the recent data is more than 50% lower than the one-day offset data:示例 PromQL,比较最近 5 分钟与昨天同一时间段,如果近期数据比一天偏移数据低 50% 以上,则发出告警:
Which can be algebraically rewritten to: 可以代数重写为:
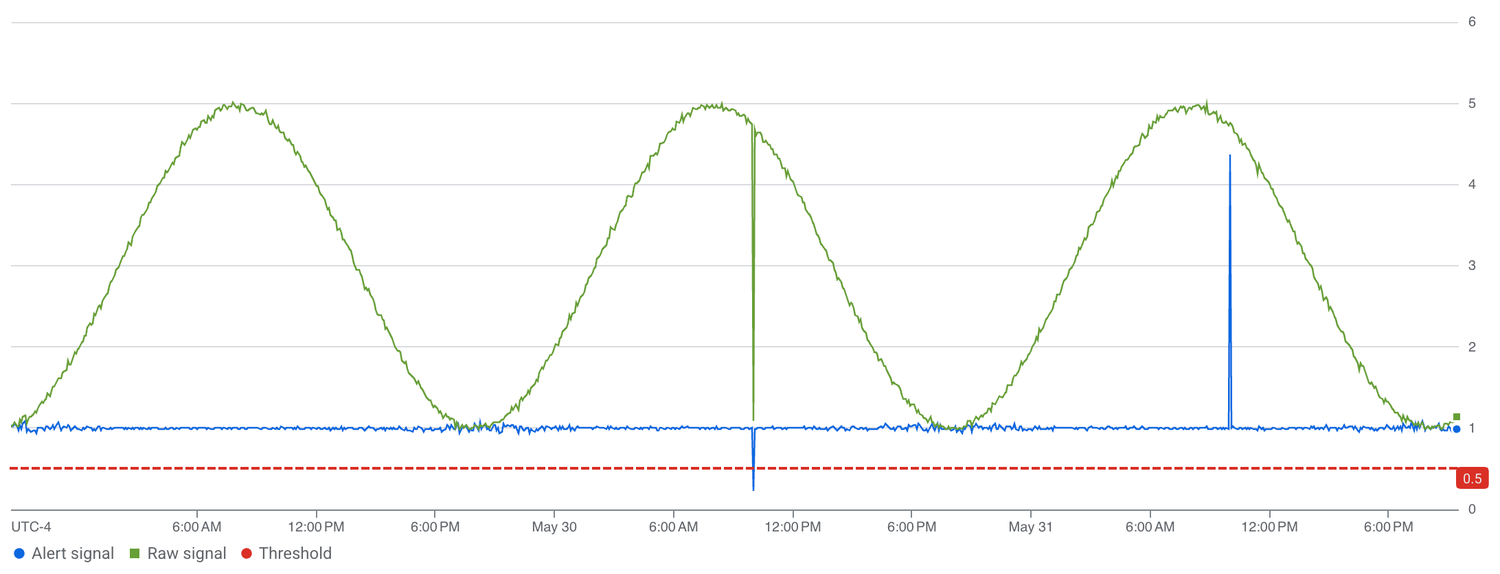
In production, you might want to compare to the same period one week ago, or compare to an average of the same period one and seven days ago, to avoid triggering on naturally lower days such as weekends and holidays:在生产环境中,您可能需要与一周前的同一时间段进行比较,或者与一天前和七天前同一时间段的平均值进行比较,以避免在周末和节假日等自然较低的日子里触发告警:
When using time offsets, you can only reliably trigger on either drops or spikes, as triggering on both sudden drops and sudden spikes in a single policy may cause your alerts to fire twice.使用时间偏移时,您只能可靠地触发下降或峰值,因为在单个策略中同时触发突然下降和突然峰值可能会导致告警触发两次。
Think of it this way: If traffic drops steeply today, your alert will trigger immediately. However, exactly 24 hours later, today's anomalous drop becomes tomorrow's historical baseline. If your policy triggers on any anomalous difference (higher or lower), the sudden "return to normal" tomorrow will look like a massive spike relative to yesterday's dip, and you will get a false alert for a phantom anomaly. You can see this in the above chart — the dip in the signal (blue line) reappears as its reciprocal exactly 24 hours later.这样想:如果今天流量急剧下降,您的告警将立即触发。然而,正好 24 小时后,今天的异常下降成为明天的历史基线。如果您的策略在任何异常差异(更高或更低)时触发,那么明天突然的'恢复正常'相对于昨天的下降将看起来像一个巨大的峰值,您将收到一个关于幽灵异常的错误告警。您可以在上图中看到这一点——信号中的下降(蓝线)在正好 24 小时后以其倒数形式重新出现。
To prevent this, you should only track either drops or spikes when monitoring any given metric.为了防止这种情况,您应该在监控任何给定指标时仅跟踪下降或峰值。
Control runaway costs using dynamic thresholds使用动态阈值控制失控成本
Once you can trigger an alert based on deviations from a historical baseline, many interesting use cases open up. For example, you can use dynamic thresholding to prevent overspend for any Google Cloud service that offers a metric that roughly tracks spend.一旦您能够基于与历史基线的偏差触发告警,许多有趣的用例就会打开。例如,您可以使用动态阈值来防止任何提供大致跟踪支出的指标的 Google Cloud 服务超支。
Say you are concerned about runaway AI token costs. You could do the following:假设您担心 AI token 成本失控。您可以执行以下操作:
-
-
Configure a dynamic threshold alert that triggers if the most recent 10 minutes of accumulated input/output token usage is more than 25x the one-week historical average, which should only catch extreme anomalous scenarios (such as leaked API keys) that will definitely result in overspend:配置一个动态阈值告警,如果最近 10 分钟的输入/输出 token 累计使用量超过一周历史平均值的 25 倍,则触发告警,这只会捕捉极端的异常场景(例如泄露的 API 密钥),这些场景肯定会导致超支:
-
sum(rate({"__name__"="aiplatform.googleapis.com/publisher/online_serving/
token_count"}[10m])) >
25 * sum(rate({"__name__"="aiplatform.googleapis.com/publisher/online_serving/sum(rate({"__name__"="aiplatform.googleapis.com/publisher/online_serving/token_count"}[10m])) > 25 * sum(rate({"__name__"="aiplatform.googleapis.com/publisher/online_serving/token_count"}[1w]))
token_count"}[1w]))
-
-
-
Trigger your alert to fire to a Pub/Sub notification channel that pushes notifications to a Cloud Run function.使您的告警触发到 Pub/Sub 通知通道,该通道将通知推送到 Cloud Run 函数。
-
That Cloud Run function then runs a workflow that uses the Cloud Quotas API to lower your Token Usage quota to 0, which immediately stops the overspend. Note that legitimate use of tokens will be paused until you can fix the problem… but at least you’ll stop the bleeding.然后,该 Cloud Run 函数运行一个工作流,使用 Cloud Quotas API 将您的 Token Usage 配额降低到 0,从而立即停止超支。请注意,合法的 token 使用将被暂停,直到您能够解决问题……但至少您止住了出血。
Sign up to be a design partner注册成为设计合作伙伴
We are working on productizing anomaly detection using dynamic thresholds so they’re easier to write. We’re also working on more complex anomaly detection algorithms in Cloud Monitoring alerting that uses AI models specifically trained on time-series data.我们正在致力于将使用动态阈值的异常检测产品化,使其更易于编写。我们还在 Cloud Monitoring 告警中研究更复杂的异常检测算法,这些算法使用专门针对时间序列数据训练的 AI 模型。
If you’re interested in sharing your thoughts and being an early adopter of what we’re building in this space, sign up to be a preview partner. We’d love to have you!如果您有兴趣分享您的想法并成为我们在这一领域构建内容的早期采用者,请注册成为预览合作伙伴。我们期待您的加入!