
🔮 The state of the AI economy🔮 AI 经济现状
We’ve reconstructed the AI economy from the bottom up我们将 AI 经济从底层重新梳理了一遍
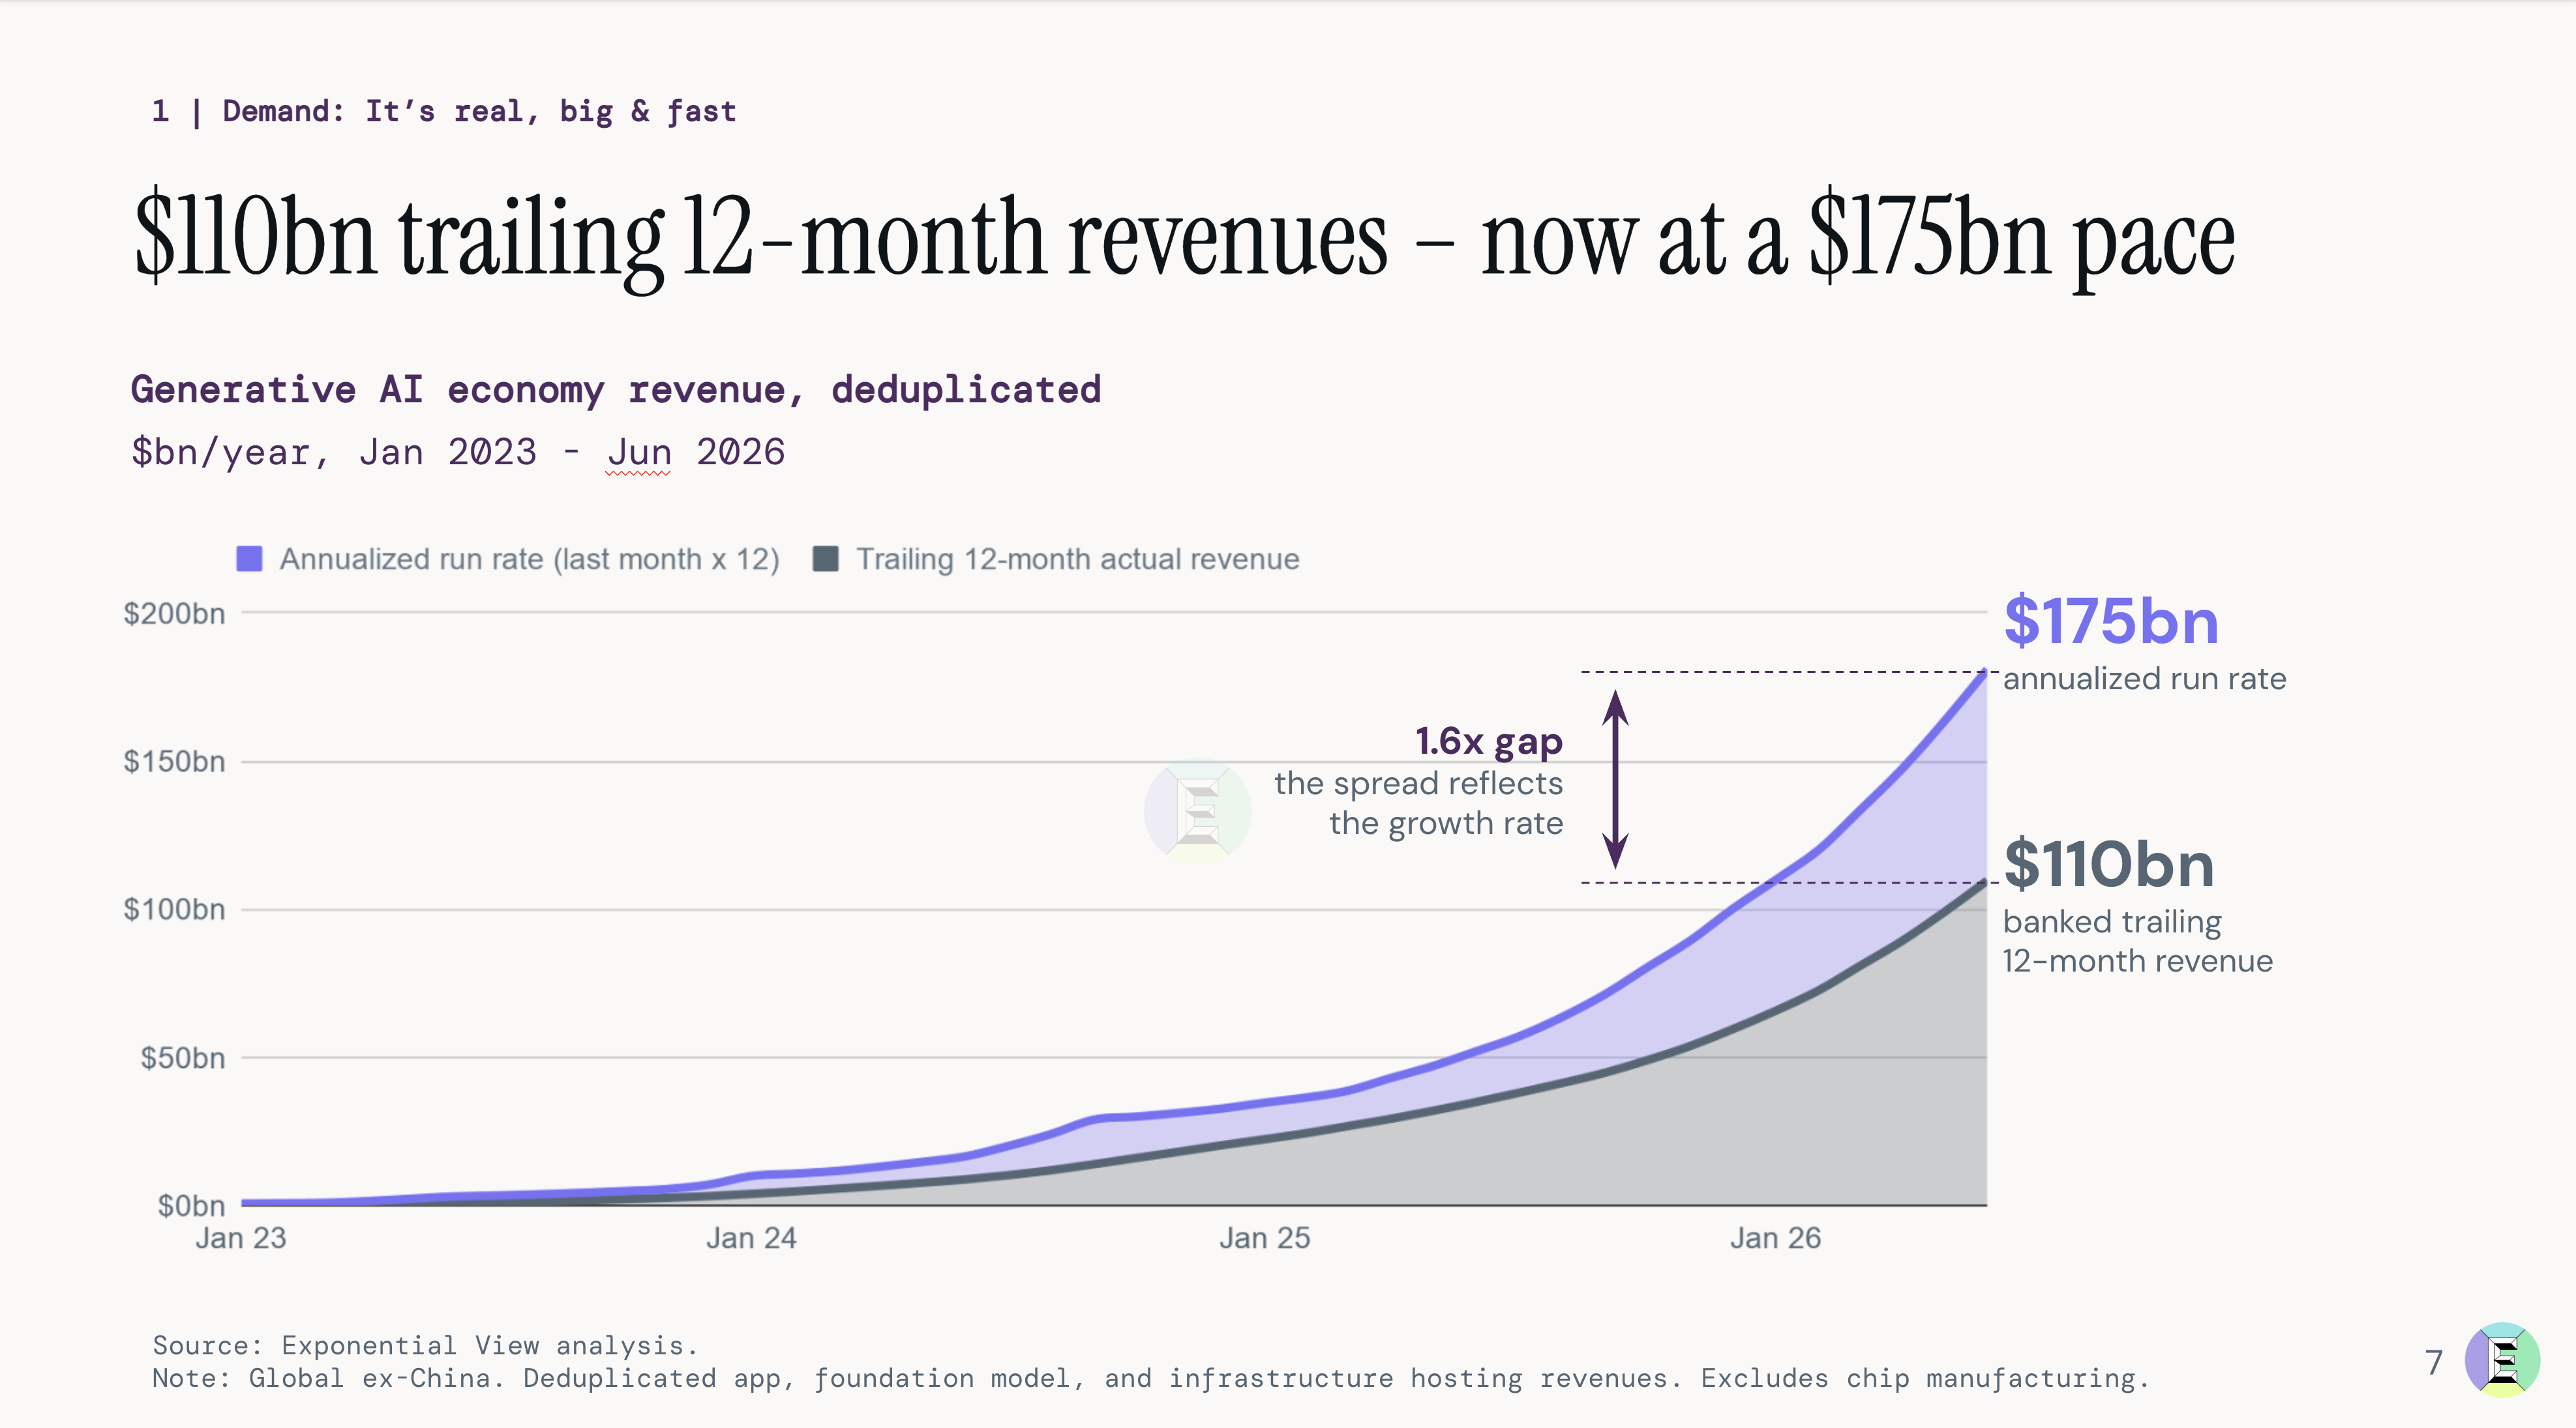
The generative AI economy has generated $110 billion in sales over the past 12 months. It is growing fast. On an annualized basis, the revenue run rate exceeds $175 billion. 过去 12 个月,生成式 AI 经济创造了 1100 亿美元销售额。增长很快。按年化算,营收运行率已超 1750 亿美元。
These numbers took us several months to construct, and as far as we know, it’s the first bottom-up, deduplicated measure of consumer and enterprise AI spending across the full stack. We are releasing this research today in our first The State of the AI Economy report. 这些数字我们算了几个月。据我们所知,这是首份针对消费者与企业 AI 全栈支出的自下而上、去重统计。今天,我们发布首份《AI 经济现状》报告。
The supply side of the AI market is well-understood. The picks and shovel suppliers, the computer chips, the memory, the power transformers, the cooling, all of the components of AI data centers are largely public companies. We get a sense of what is being spent on the buildout through their disclosures, sales and forward order books.AI 市场的供应侧很清晰。卖铲子的、做芯片的、存数据的、变压的、搞冷却的,全是上市公司。看它们的财报、订单和销售,大致能摸清投入了多少。
But understanding the demand side is much harder. And this is what we’ve spent the last few months tackling. We built a proprietary AI economy model that looks at total AI spend, whether enterprise or consumer, to answer the hardest questions of the AI wave:需求侧难算。这几个月,我们就在啃这块骨头。我们建了一个专有的 AI 经济模型,盯着企业和消费者的总支出,专攻 AI 浪潮中最难的问题:
How big is the market really?市场到底有多大?
Are the revenues growing?营收在涨吗?
How far do the revenues go to cover the investment expense?营收能覆盖投资成本吗?
What happens to the economics in the future as token prices fall and the quality of those tokens improves?未来 Token 价格跌了、质量升了,经济账怎么算?
Before we get into the report, we think it’s important to break down how we did this work.看报告前,得先说说我们是怎么干的。
THE METHODOLOGY
How we count the demand side如何统计需求侧
One of our central design choices was not to count the same thing twice. We report the dollar spent by an end customer. So if you spend one dollar with Anthropic for Claude and Anthropic spends 50 cents with Amazon to serve it, we track both figures internally, but we will report it as our de-duplicated number: one dollar. This avoids double-counting the value that flows through the supply chain. 核心原则是不重叠。我们只记终端客户花的钱。你给 Anthropic 一块钱买 Claude,Anthropic 给 Amazon 五毛钱跑服务。我们内部记两笔,汇总时只算一块钱。这样就去掉了供应链里的重复计算。
This isn’t straightforward. While it’s easy to count the supply side, the demand side is trickier to entangle. Much of the revenue flowing into AI comes from privately held companies such as OpenAI, Anthropic, Cursor, ElevenLabs, and hundreds of others. They don’t legally need to disclose anything. 这事不简单。供应侧好算,需求侧绕。钱流向了 OpenAI、Anthropic、Cursor、ElevenLabs 等一堆私企。它们没义务披露。
The remainder flows to the big hyperscalers that serve these models: Amazon, Google, and Microsoft. While they are public, they don’t consistently disclose their AI segment revenues.剩下的钱流向 Amazon、Google、Microsoft 这些超大规模云厂商。它们虽是上市公司,但 AI 业务营收从不拆细。
To shed light on this, we examine public statements from hyperscalers and neoclouds, their suppliers, and their customers, using only high-confidence, detailed facts to inform our modeling. We also look at well-reported leaks and self-reports, to which we assign a confidence score.为了搞清真相,我们扒了云厂商、新锐云、供应商和客户的公开表述。只用高置信度的细节来建模。那些泄露和自报的数据,我们都给了置信度评分。
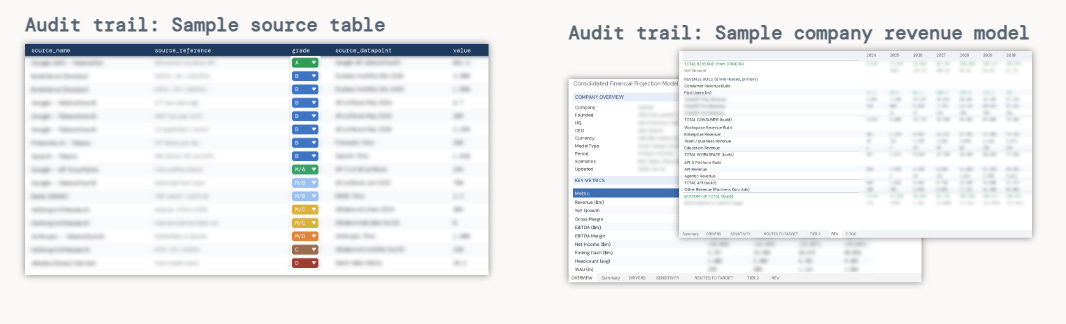
The result is an item-by-item financial model for the largest contributing companies and business units. Each model is effectively a deconstructed financial plan, a P&L, balance sheet, and cash flow, and these are triangulated against other external sources and internal consistency checks. This makes our numbers auditable. We can identify which data point, with which confidence weighting, contributed to any given estimate.最后,我们给大厂和部门做了逐项财务模型。损益表、资产负债表、现金流,全都拆解开,再和外部来源交叉验证。数字可审计。哪条数据、什么权重,都能查得清。
What we don’t count什么没算
We don’t include internal AI uplift, which is how much recommendation systems have improved, increasing ad revenue at Meta or Google. We do have models for those, but we’re not reporting them here. 没算内部 AI 增益,比如推荐系统帮 Meta 或 Google 涨了多少广告费。模型有,但这次不报。
Nor do we consider efficiency savings that the bigger tech companies might realize with their internal tools. We’re not tracking that yet. 没算大厂内部工具省下的钱。还没开始追踪。
We don’t include professional services and systems integration. When a Fortune 500 company spends or invests in AI, only a portion of that spend will go to an AI company. It won’t represent the full extent of their commitment, because a large part of it will be paying professional services to support the implementation.没算专业服务和系统集成。财富 500 强投 AI,只有一部分钱给了 AI 公司。大部分给了实施服务商,这不算在内。
We have got models for revenues in China, but this v1 of our report doesn’t include Chinese data yet.中国市场的营收模型我们有,但这份 v1 报告还没放进去。
THE TOP LINE
Are the revenues real?营收是真的吗?
Over the past 12 months, the AI ecosystem generated $110 billion in revenue when you remove double-counting. The growth rate is healthy. Annualizing the most recent month’s revenues indicates a $175 billion revenue run rate. 过去 12 个月,去重后的 AI 生态营收 1100 亿美元。增长健康。按最近一个月年化,运行率 1750 亿美元。
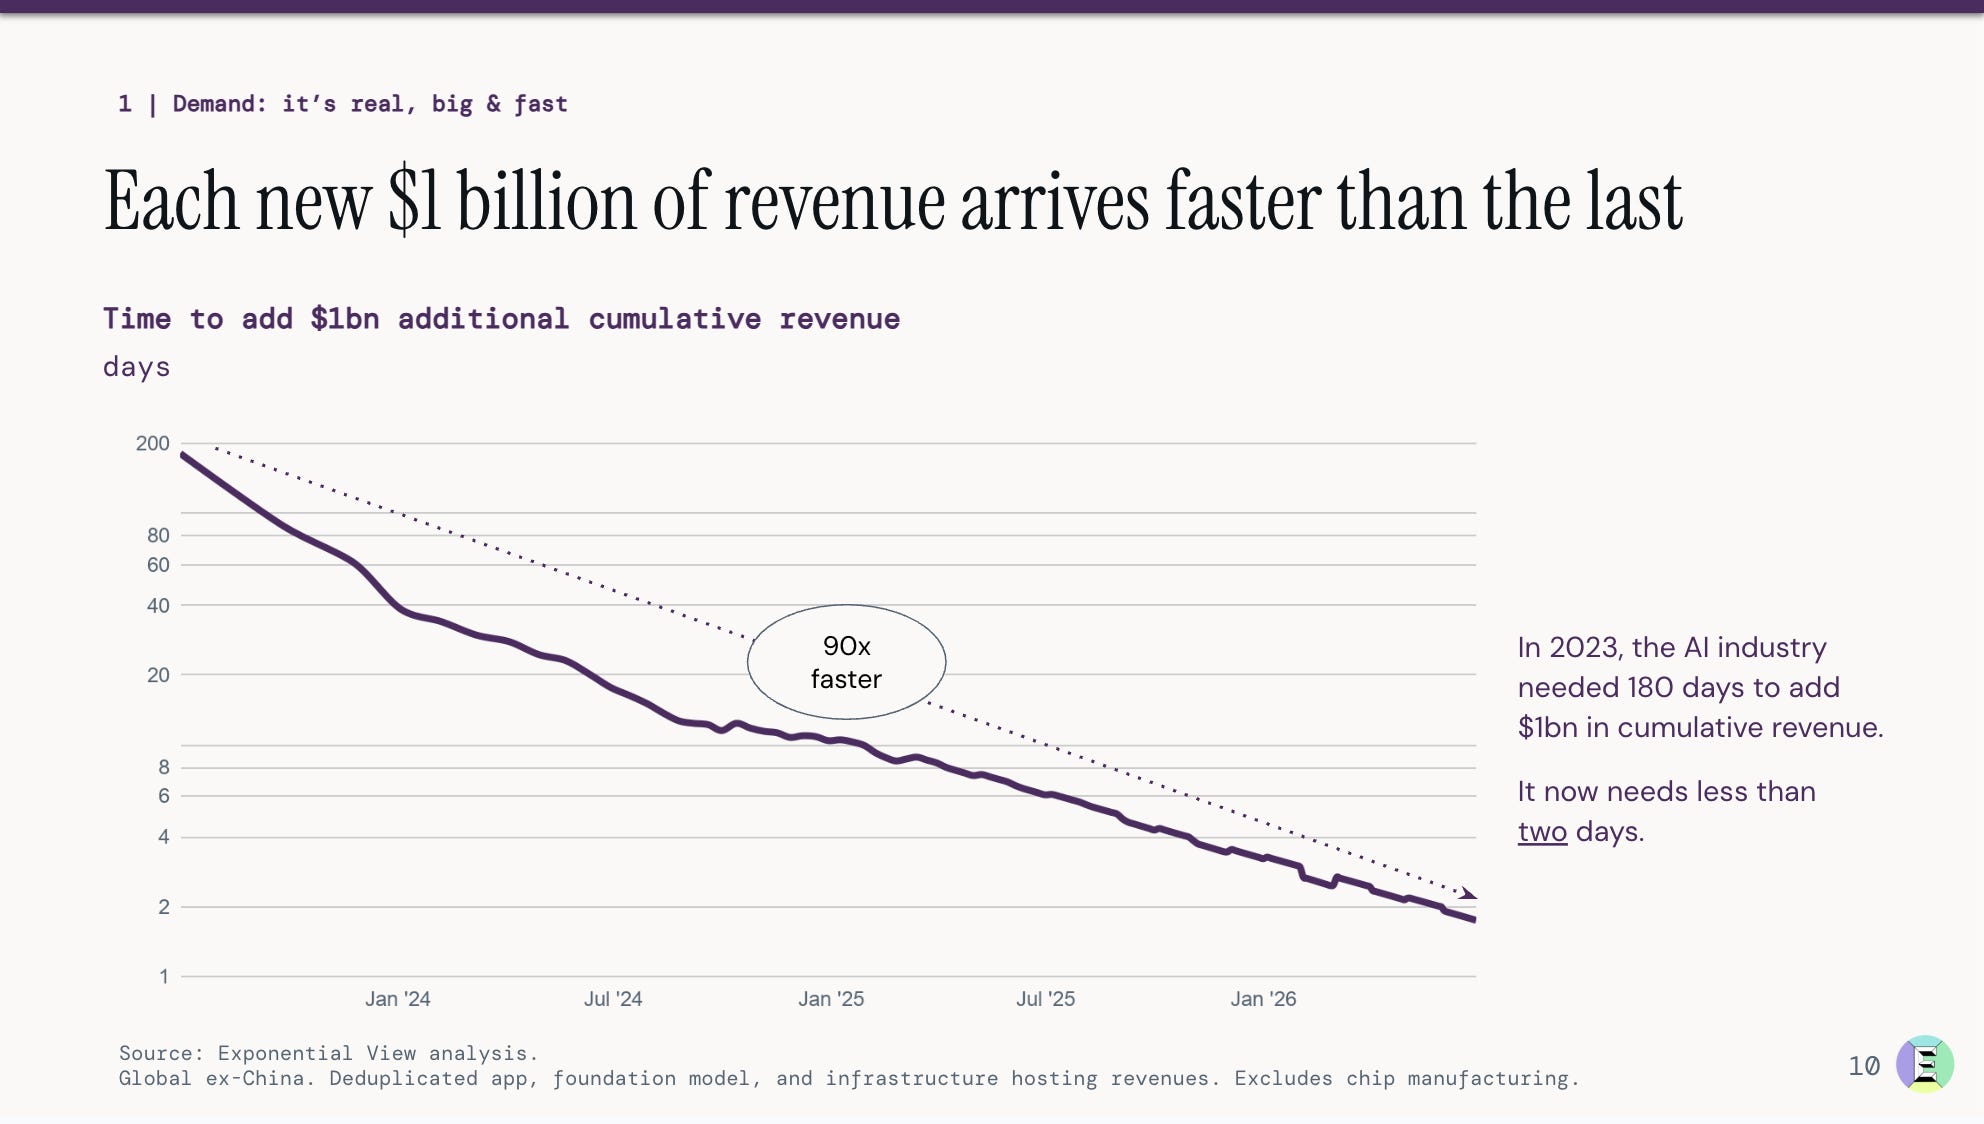
These revenues are growing faster than previous IT-oriented waves, roughly three times more rapidly than the mobile or Internet waves. 这比以前的 IT 浪潮快,大概是移动互联网或互联网浪潮的三倍。
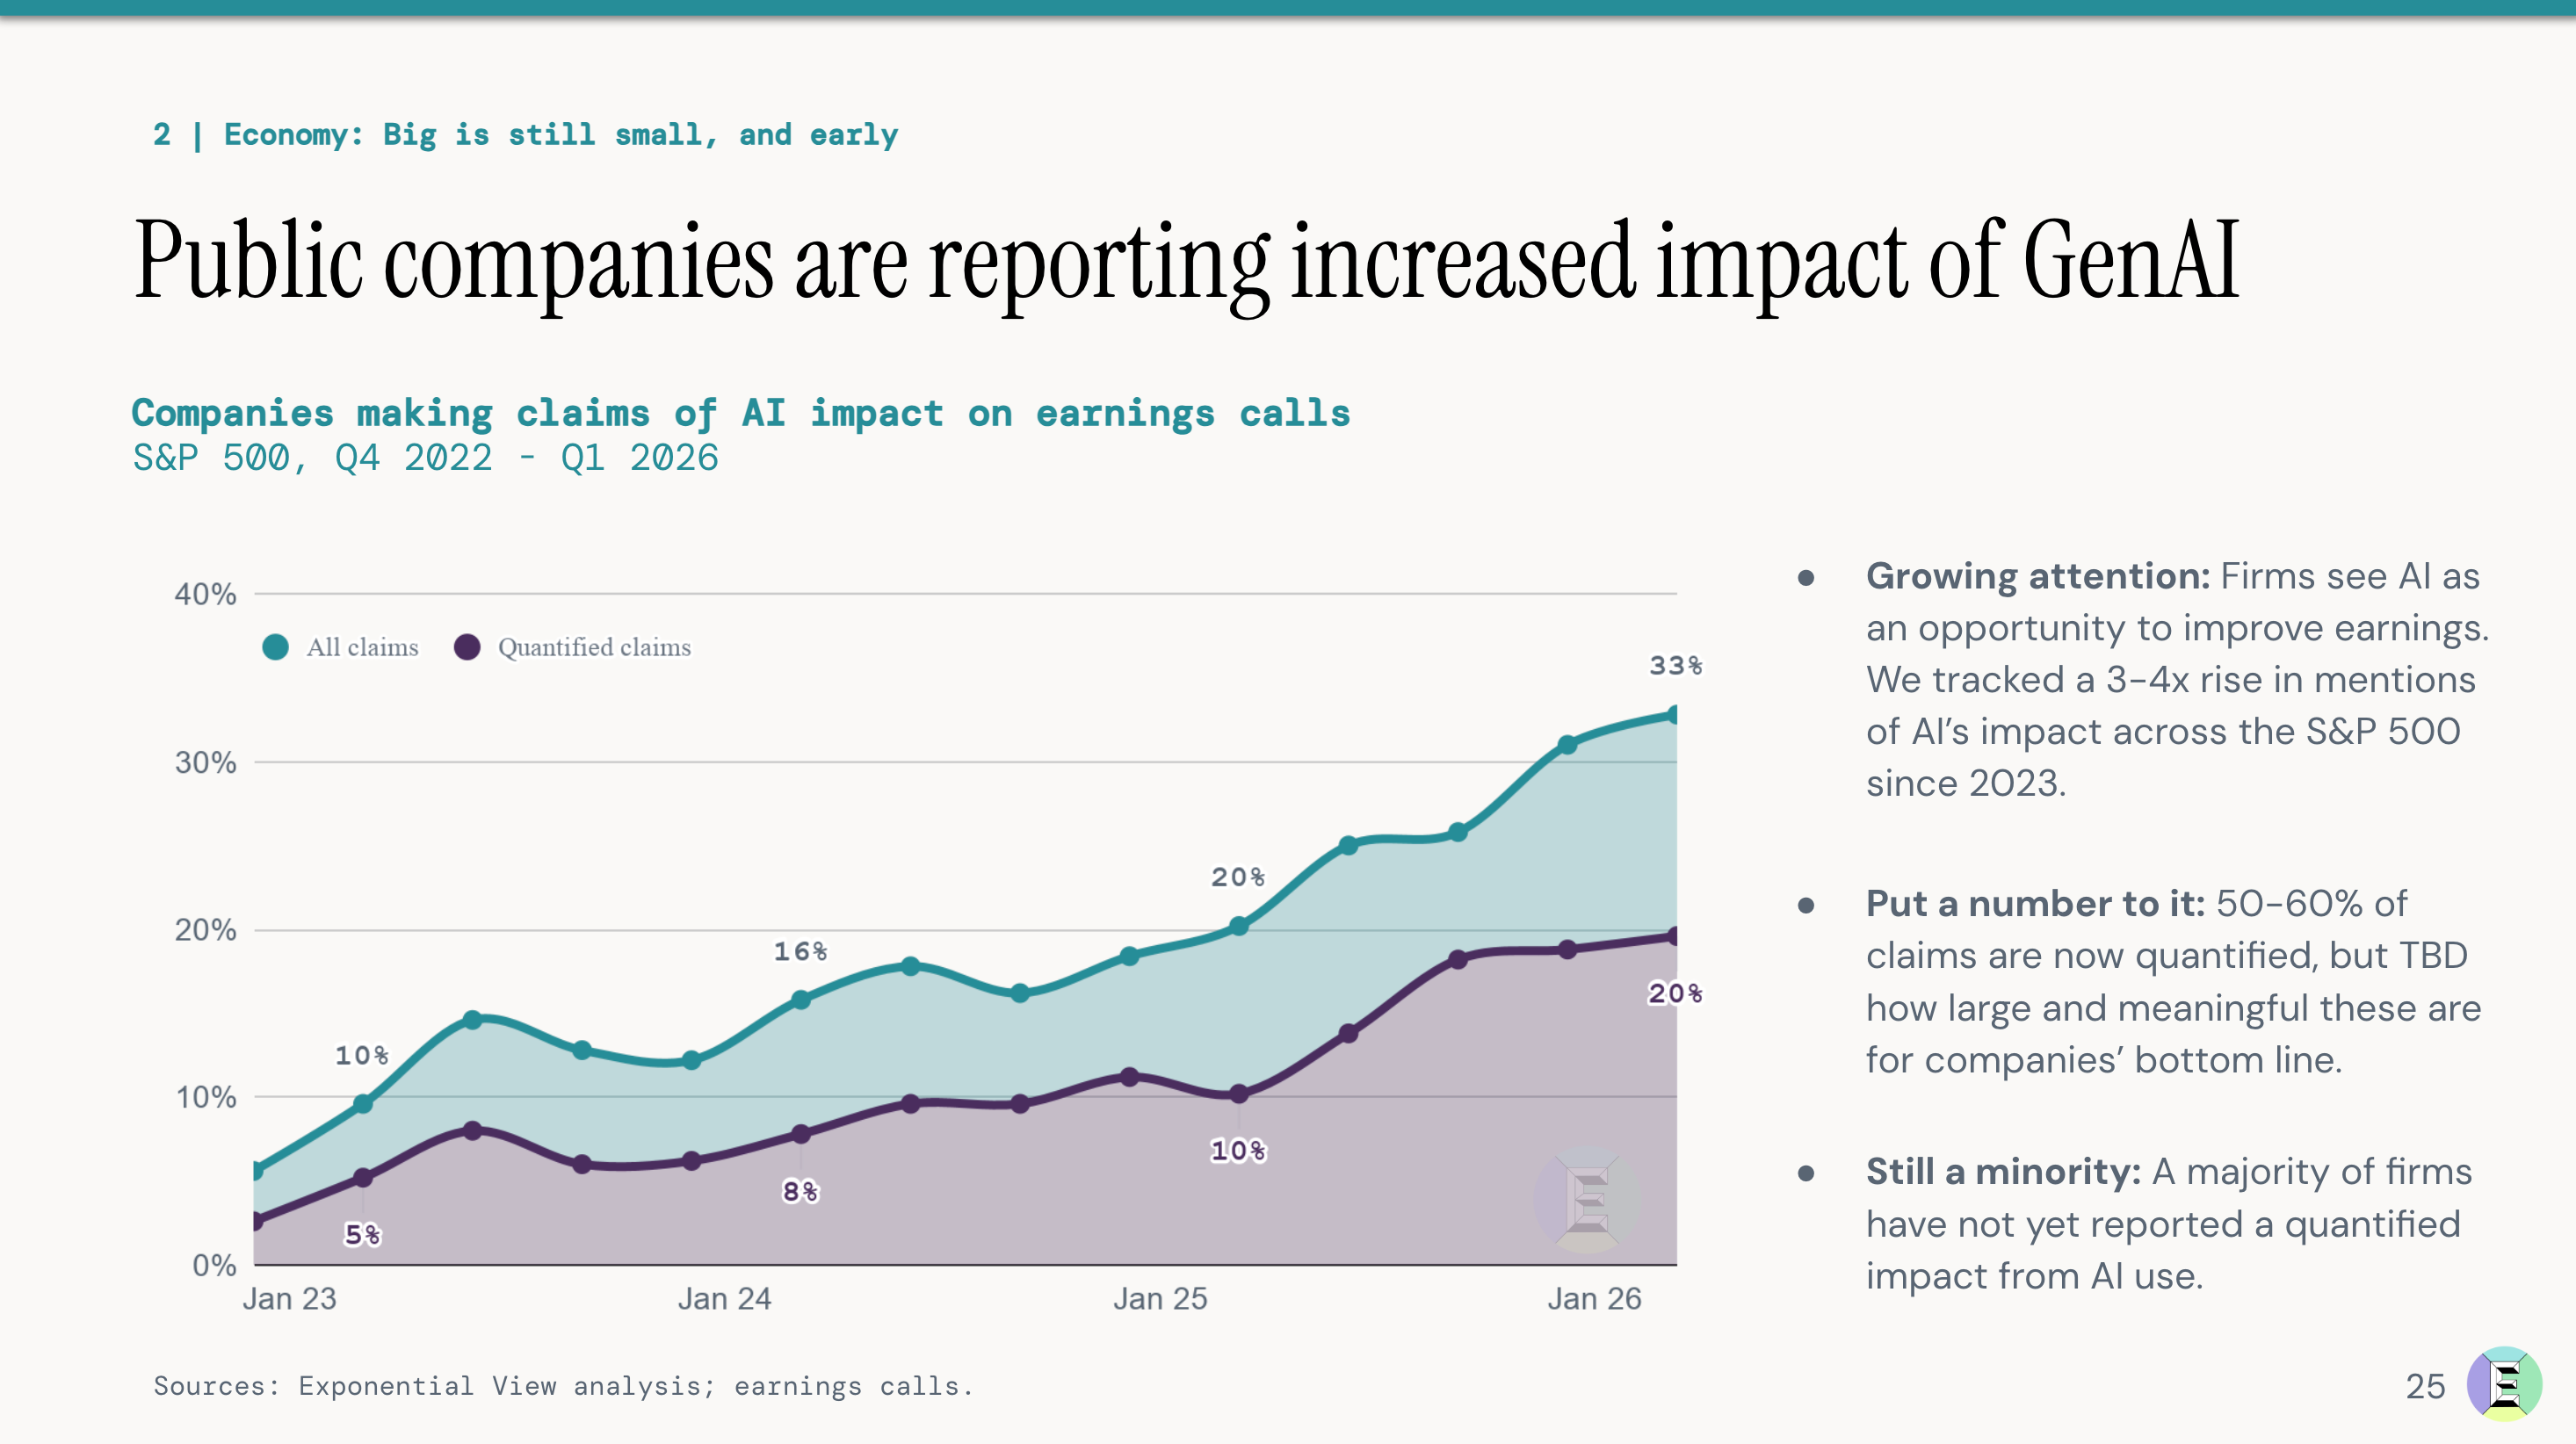
While many companies have moved beyond occasional pilots, they are still in the early stages of scaling and deepening. In conversations Azeem has had with senior execs across a range of industries in Europe and the US (from industrials to insurance, from finance to pharma), the consistent message is that they intend to invest more heavily in AI in the coming years. Companies are also becoming more vocal about the impact of AI on earnings calls, with the caveat that half of the surveyed CEOs believe their jobs depend on getting AI right.很多公司已过了试水期,正往深里做。Azeem 聊过欧美各行高管,工业、保险、金融、医药都有。大家口径一致:往后几年要加大投入。财报会上,CEO 们也更爱谈 AI,虽然一半人觉得干不好 AI 饭碗就丢了。
Can AI revenues pay the GPU bill?AI 营收能付 GPU 的账吗?
The next question we wanted to track is whether AI revenues can cover the capital investment that’s required to build the infrastructure. Our model separates AI-oriented CapEx from ordinary CapEx across the major hyperscalers and neoclouds, the specialist AI cloud providers. This adjustment is important because hyperscalers were already spending around $120 billion annually1 on CapEx before ChatGPT. 我们想看营收能不能覆盖基建投入。模型把 AI 资本支出(CapEx)从常规支出里剥离出来。ChatGPT 之前,云厂商每年就投 1200 亿。
We capture the additional investment in AI infrastructure, then depreciate compute assets over 6 years and other infrastructure over 14 years. Our modeling shows that revenues attributable to hyperscalers just about clear the depreciation expense.我们算上 AI 基建的额外投入,计算资产折旧 6 年,其他基建 14 年。模型显示,云厂商的 AI 营收刚好覆盖折旧。
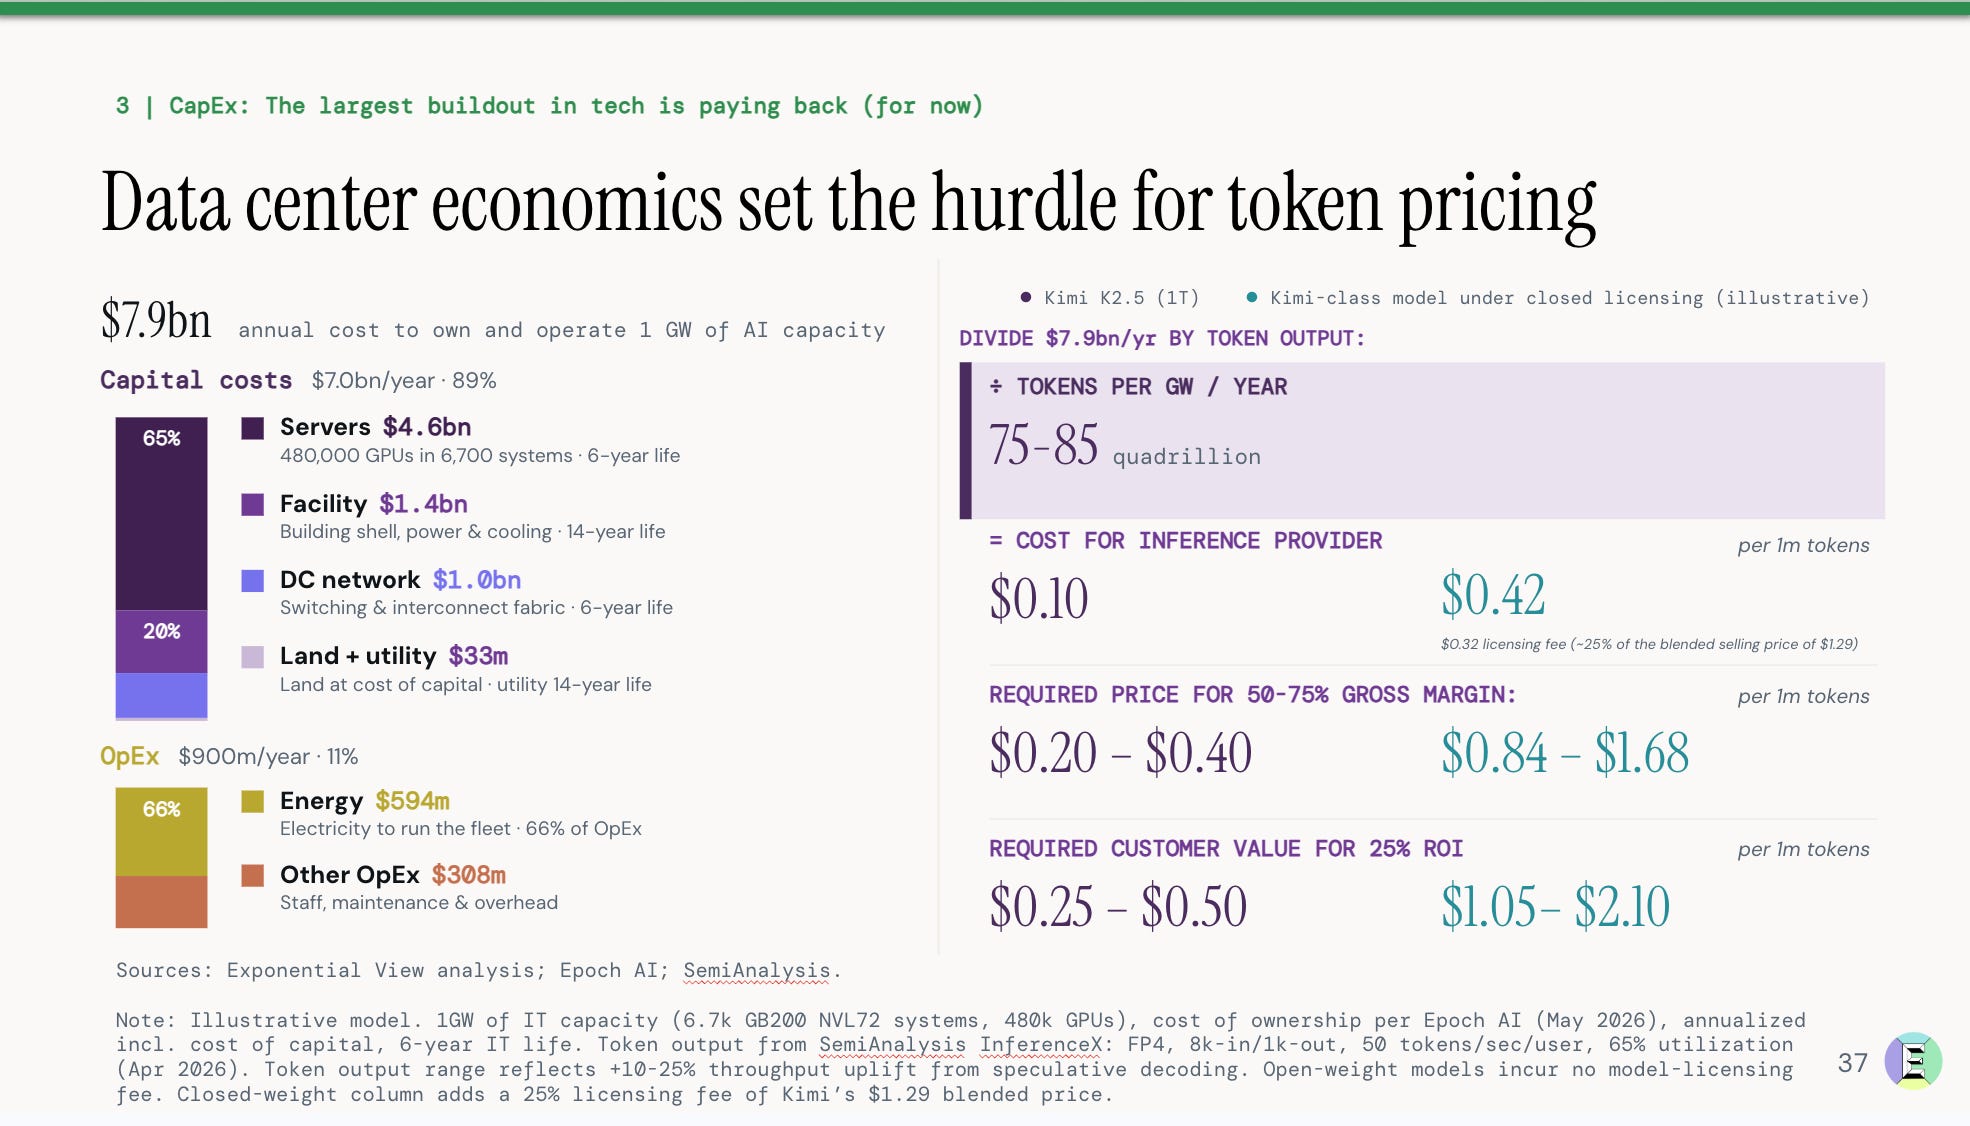
Six years is defensible. That longer useful life reflects two things. One, demand still exceeds available AI compute; and two, operators are getting better at managing GPU fleets. Both help. The second alone is enough to justify a longer economic life.6 年折旧站得住脚。两点原因:一是需求还没吃饱,二是 GPU 集群管理水平在提升。后者足以支撑更长的经济寿命。
What is the future of the token?Token 的未来
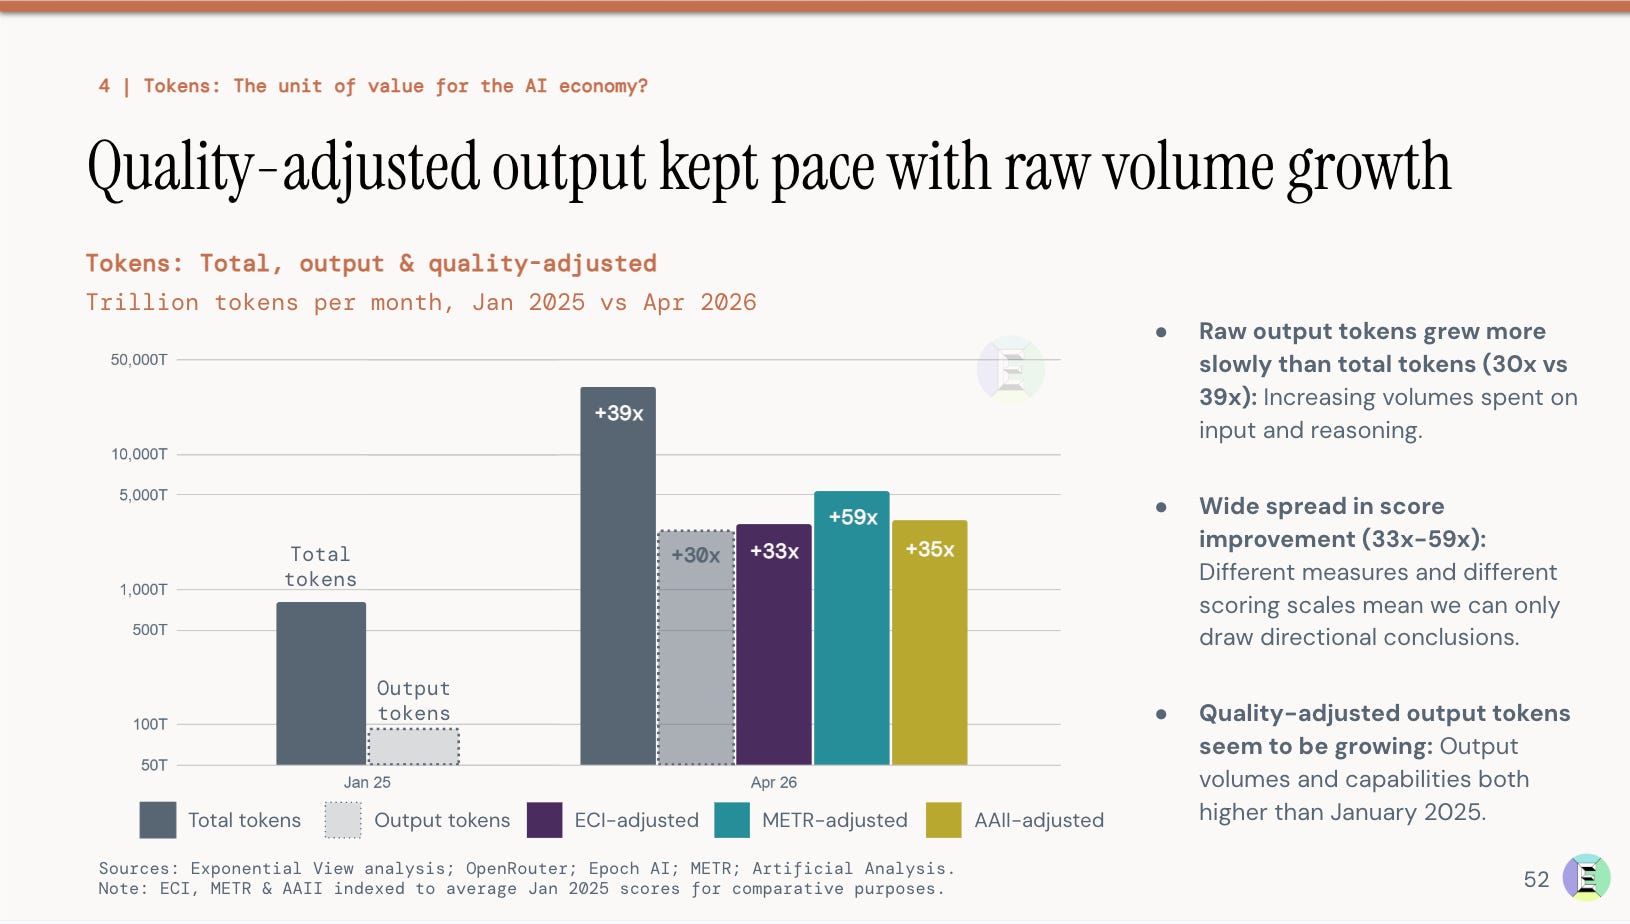
We also examine how market size changes as token prices fall. The elasticity of demand shows that lower prices are met with increased spending. We estimate that across providers, every 10% price cut leads to 12-18% more tokens in use, so the total spend still rises. 我们看了价格下跌对市场的影响。需求有弹性,降价能换来更多支出。各家供应商的数据显示,降价 10%,Token 用量涨 12-18%,总支出还是涨。
We suggest that although a token is a useful billing metric, it is still not the unit of value we need to measure the economic value of intelligence circulating through the sector. Quality‑adjusted output tokens give us a better “intelligence quotient” for the AI economy by combining how many tokens are produced, how many of them are actually user‑visible outputs, and how capable the underlying models are.Token 是账单单位,但不是衡量智能价值的单位。我们用“质量调整输出 Token”来算,结合产出量、用户可见度和模型能力,这才是 AI 经济的“智商”。
What else is in the report 报告还写了什么
The report also covers:报告涵盖:
What AI demand has done to the US power industry and how power efficiency is changing,AI 需求对美国电力行业的影响及能效变化;
What is happening to token costs, and how consumption-based billing may expand the market,Token 成本走势及按量计费如何扩大市场;
Four scenarios for how fast AI demand could grow under different price and capability trajectories.四种不同价格与能力路径下的 AI 需求增长情景。
This is v1, and we’d love your constructive feedback on what to improve and how you can help. Email us at aieconomy [at] exponentialview.co这是 v1 版本。欢迎提出建设性意见。请发邮件至 aieconomy [at] exponentialview.co
Google, Microsoft and Amazon (whose spending included logistics investments). This number excludes Meta.


The usable unit of value slide is the best one - question remains on what will be left for the rest of us.
Act as System Integrators? Harness Designers?
Several questions to be discovered and a lot to be developed towards the downstream.
cheers!
rogério
A couple of comments here are circling the power question, so one angle from the infrastructure side.
In the State of the AI Economy deck, slide 36 carries the cost of consumed electricity: the $594m energy line, which is reasonable on its own. What it does not separately identify is the cost and lead time to make a GW of IT load actually available at the site. On-site power and cooling sit in the facility line, but utility-side interconnection, transmission, substations, queue timing, and fixed-capacity commitments appear only inside a $33m "land + utility" line, if at all.
That matters because large-load power is not purely usage-based. Demand charges, minimum-billing demand, and take-or-pay commitments keep much of the bill fixed even when utilization runs below plan. And slides 32-34 frame "headroom" as revenue after depreciation, not after OpEx, so energy is in the slide 36 unit cost but outside the "paying back" claim.
Slide 16's data center examples show both paths. Rainier in New Carlisle takes the grid route: a ~2.3 GW build phased over years, with a $150m+ transmission and 345kV substation buildout. xAI's Colossus took the other route, self-supplying ~1.2 GW of gas off-grid because the interconnection queue was too slow; per the SpaceX IPO filings it now runs ~1 GW of IT compute across three buildings, well past the chart's early-2025, single-building 300 MW marker.
Forward-looking, the swing on cost per token is less the marginal electricity price and more when, how, and under what fixed commitments a site gets powered.