

Key Takeaways关键要点
You can't monitor agents like traditional software. Inputs are infinite, behavior is non-deterministic, and quality lives in the conversations themselves. This article explains what to monitor, how to scale evaluation, and how production traces become the foundation for continuous improvement.你无法像监控传统软件那样监控智能体。输入是无限的,行为是非确定性的,而质量体现在对话本身。本文解释了需要监控的内容、如何扩展评估,以及生产环境中的追踪记录(traces)如何成为持续改进的基础。
When you ship traditional software to production, you have a good sense of what to expect. Users click buttons, fill out forms, navigate through predetermined paths. Your test suite might cover 80-90% of code paths, and monitoring tools track the usual suspects: error rates, response times, database queries. When something breaks, you look at stack traces and logs.当你将传统软件发布到生产环境时,你很清楚会发生什么。用户点击按钮、填写表单、按照预定的路径导航。你的测试套件可能覆盖了 80-90% 的代码路径,监控工具会跟踪常见的指标:错误率、响应时间和数据库查询。当出现问题时,你会查看堆栈跟踪和日志。
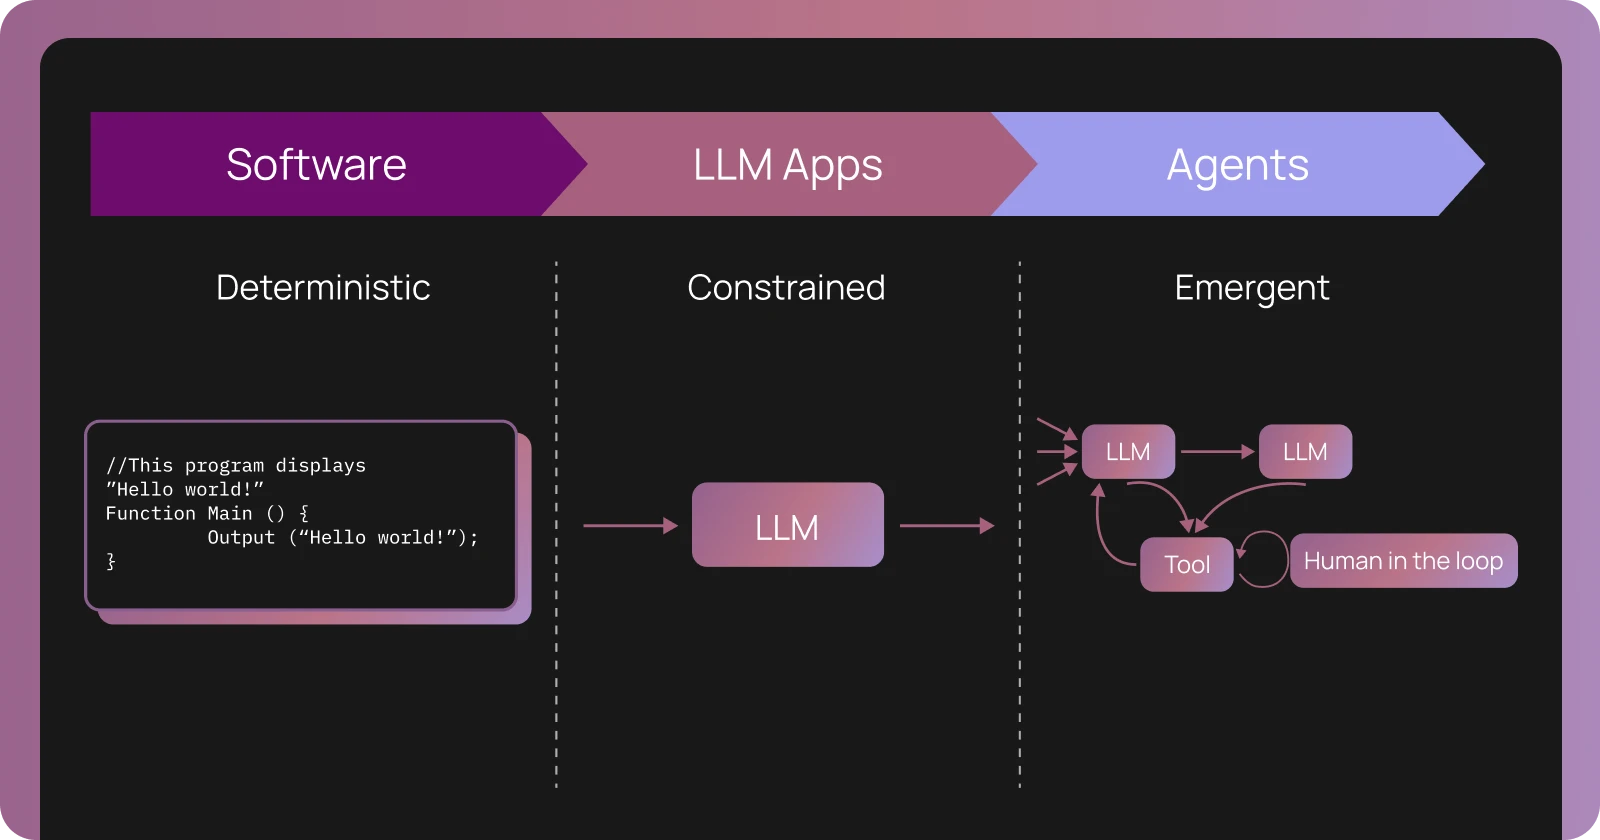
Agents operate differently. They accept natural language input, where the space of possible queries is unbounded. They're powered by large language models that are sensitive to subtle variations in prompts and can produce different outputs for the same input. And they make decisions through multi-step reasoning chains, tool calls, and retrieval operations that are difficult to fully anticipate during development.智能体的运作方式则不同。它们接受自然语言输入,查询空间是无限的。它们由大语言模型驱动,对提示词(prompt)的细微变化非常敏感,并且对于相同的输入可能会产生不同的输出。此外,它们通过多步推理链、工具调用和检索操作来做出决策,这些在开发过程中很难完全预见。
This means that production monitoring for agents requires different capabilities than traditional observability. In this post, we'll explore why agent observability has distinct challenges, what you need to monitor, and what we've learned from teams deploying agents at scale.这意味着智能体的生产环境监控需要与传统可观测性不同的能力。在本文中,我们将探讨为什么智能体可观测性面临独特的挑战,你需要监控什么,以及我们从大规模部署智能体的团队中学到了什么。
Why agents are different from traditional software为什么智能体与传统软件不同
Working with teams deploying agents to production, we've observed two key distinctions that affect monitoring approaches.在与部署智能体到生产环境的团队合作时,我们观察到了两个影响监控方法的关键区别。
Agent have an infinite input space智能体拥有无限的输入空间
Traditional software has a finite, constrained input space. Users interact through buttons, dropdowns, forms, and API calls with specific formats. When you design a checkout flow, you know the exact sequence of screens and possible user actions. Your error handling can be comprehensive because you can enumerate the failure modes.传统软件拥有有限且受约束的输入空间。用户通过按钮、下拉菜单、表单和特定格式的 API 调用进行交互。当你设计结账流程时,你知道屏幕的确切顺序和用户可能的操作。你的错误处理可以非常全面,因为你可以枚举所有失败模式。
Agents, by contrast, accept natural language as their primary input. Natural language has no fixed set of valid inputs. Users can phrase the same request in countless ways — vague or specific, formal or casual, combining multiple intents in a single message or spreading a single request across multiple turns.相比之下,智能体以自然语言作为主要输入。自然语言没有固定的有效输入集。用户可以用无数种方式表达同一个请求——模糊或具体、正式或随意,可以在一条消息中结合多个意图,或者将一个请求分散在多轮对话中。
Consider a customer support agent. In traditional software, users would navigate to "Order History," click on an order, click "Request Refund," and finally fill out a form with predefined options. The path is fixed and testable.以客户支持智能体为例。在传统软件中,用户会导航到“订单历史”,点击一个订单,点击“申请退款”,最后填写一个带有预定义选项的表单。路径是固定的且可测试的。
With an agent, users might say:使用智能体时,用户可能会说:
- "I want to return my order"“我想退货”
- "Can you help me get my money back for the shoes I bought last week?"“你能帮我把我上周买的鞋子的钱退回来吗?”
- "The item I received is damaged, what are my options?"“我收到的商品损坏了,我有什么选择?”
- "order #12345 refund please"“订单 #12345 请退款”
.png)
Each represents the same underlying intent, but the agent needs to understand the variation, extract the relevant information, and determine the appropriate actions.每一个都代表相同的潜在意图,但智能体需要理解这种差异,提取相关信息,并确定适当的操作。
This infinite input space means you cannot fully predict how your agent will be used until real users start interacting with it.这种无限的输入空间意味着在真实用户开始与之交互之前,你无法完全预测你的智能体将如何被使用。
LLMs are not robust to small changes大语言模型对微小变化不具备鲁棒性
The second key difference is that LLMs exhibit prompt sensitivity and non-deterministic behavior. Even small variations in input can lead to different outputs, and the same input can sometimes produce different results.第二个关键区别是,大语言模型表现出提示词敏感性和非确定性行为。即使输入的微小变化也可能导致不同的输出,相同的输入有时也会产生不同的结果。
This happens for several reasons. LLMs use probabilistic sampling during generation, which introduces variance. Most importantly, LLMs respond differently to subtle changes in phrasing, context, or instruction ordering.这有几个原因。大语言模型在生成过程中使用概率采样,这引入了方差。最重要的是,大语言模型对措辞、上下文或指令顺序的细微变化反应不同。
This non-determinism means that the behavior you observe in development may not match what happens in production. A prompt that works reliably in testing might fail on edge cases you didn't encounter. An agent that correctly uses tools during evaluation might occasionally select the wrong tool for user queries with slightly different phrasing.这种非确定性意味着你在开发中观察到的行为可能与生产环境中的不一致。一个在测试中表现可靠的提示词可能会在未遇到的边缘情况下失败。一个在评估期间正确使用工具的智能体,可能会偶尔为措辞略有不同的用户查询选择错误的工具。
Production monitoring for agents is different智能体的生产环境监控与众不同
Traditional Application Performance Monitoring (APM) tools focus on metrics like latency, traffic, errors, and saturation. They track HTTP requests, database queries, and system resources. They're designed for structured, deterministic systems where you know the possible code paths.传统的应用性能监控(APM)工具专注于延迟、流量、错误和饱和度等指标。它们跟踪 HTTP 请求、数据库查询和系统资源。它们是为结构化、确定性的系统设计的,在这些系统中,你知道可能的代码路径。
Agent observability requires monitoring the inputs and outputs themselves, not just the system metrics around them.智能体可观测性需要监控输入和输出本身,而不仅仅是围绕它们的系统指标。
Monitoring natural language interactions监控自然语言交互
When your agent is having conversations with users, the primary signal lives in the conversations themselves. You need to capture:当你的智能体与用户进行对话时,主要的信号存在于对话本身。你需要捕获:
- Complete prompt-response pairs: Not just that a request happened, but what the user asked and what the agent responded完整的提示-响应对:不仅仅是发生了请求,还要知道用户问了什么以及智能体回答了什么
- Multi-turn context: Agents often operate across multiple exchanges as part of one conversation, so you need to group related interactions together多轮上下文:智能体通常在一次对话中进行多次交流,因此你需要将相关的交互归为一组
- Agent trajectory and intermediate steps: Agents can take multi-step paths to reach a final output, calling tools and reasoning through options. You need visibility into each step of the trajectory, not just the final response智能体轨迹和中间步骤:智能体可以采取多步路径来达到最终输出,调用工具并推理选项。你需要对轨迹的每一步都有可见性,而不仅仅是最终响应
This is qualitatively different from traditional logging. A traditional web request might be summarized as "POST /api/checkout 200 OK 342ms." An agent interaction is a natural language conversation with potentially dozens of steps — and the question of whether it went well isn't answerable from the status code.这与传统日志有本质区别。传统的 Web 请求可以总结为“POST /api/checkout 200 OK 342ms”。而智能体交互是一场可能包含数十个步骤的自然语言对话——而且仅凭状态码无法回答它是否表现良好。
The challenge of human judgment at scale大规模人类判断的挑战
Natural language interactions often require human judgment to evaluate properly. Is this response helpful? Did the agent understand the user's intent? Was the tone appropriate? Did it retrieve relevant information?自然语言交互通常需要人类判断才能正确评估。这个回答有帮助吗?智能体理解用户的意图了吗?语气合适吗?它检索到了相关信息吗?
During development, this is manageable — you review traces manually, tweak prompts, and iterate. But in production, you might be handling thousands or millions of interactions. Human reviewers can meaningfully assess 50-100 traces per hour, but at 1,000 requests per day, full manual review would require 10-20 hours of dedicated human time, daily. This raises an important question: how do you bring human intelligence to production data when manual review doesn't scale?在开发过程中,这是可控的——你可以手动审查轨迹、调整提示词并进行迭代。但在生产环境中,你可能需要处理成千上万甚至数百万次交互。人类审查员每小时可以有意义地评估 50-100 条轨迹,但如果每天有 1,000 次请求,完全手动审查每天将需要 10-20 小时的人力。这提出了一个重要问题:当手动审查无法扩展时,你如何将人类智能引入生产数据?
We've found two complementary approaches effective.我们发现两种互补的方法很有效。
Annotation queues for structured human review用于结构化人工审查的标注队列
Annotation queues help make human review as efficient as possible. Rather than asking reviewers to hunt through production logs, an annotation queue presents specific runs in a structured format with a predefined rubric.标注队列有助于使人工审查尽可能高效。标注队列不是让审查员在生产日志中搜寻,而是以结构化格式呈现特定的运行记录,并附带预定义的评估准则。
An effective annotation queue system lets you:一个有效的标注队列系统可以让你:
- Route specific traces for review: Instead of reviewing everything, send particular subsets to the queue (runs with negative feedback, high-cost interactions, or queries from a specific time window)路由特定轨迹进行审查:不要审查所有内容,而是将特定的子集发送到队列(带有负面反馈的运行、高成本交互或特定时间窗口的查询)
- Define review criteria: Set up rubrics so reviewers know exactly what to evaluate (relevance, correctness, tone, safety)定义审查标准:设置评估准则,以便审查员确切知道要评估什么(相关性、准确性、语气、安全性)
- Enable team collaboration: Multiple reviewers can work through queues with progress tracking and role assignments实现团队协作:多名审查员可以通过进度跟踪和角色分配共同处理队列
- Create feedback loops: Reviewed data can be annotated with corrections and added to evaluation datasets创建反馈循环:审查过的数据可以标注修正意见,并添加到评估数据集中

Annotation queues are especially valuable when you're trying to understand a new failure mode, build up training data for evaluators, or get expert domain feedback on specialized queries.当你试图理解一种新的失败模式、为评估器构建训练数据或获取关于专门查询的专家领域反馈时,标注队列特别有价值。
Trade-offs to consider: Annotation queues require dedicated reviewer time and can introduce latency into the improvement cycle. We've found they work best when focused on specific high-value traces rather than attempting comprehensive coverage.需要考虑的权衡:标注队列需要专门的审查员时间,并可能在改进周期中引入延迟。我们发现,当专注于特定的高价值轨迹而不是试图进行全面覆盖时,它们的效果最好。
LLM as a proxy for human judgment 以大语言模型作为人类判断的代理
The second approach is to use LLMs themselves to scale human judgment. While LLMs aren't perfect evaluators, they can assess many quality dimensions at a scale that humans cannot.第二种方法是使用大语言模型本身来扩展人类判断。虽然大语言模型不是完美的评估器,但它们可以在人类无法企及的规模上评估许多质量维度。
In particular, you can configure online evaluators to run automatically on production traffic, either on all runs or on a sampled subset. These evaluators can check:特别是,你可以配置在线评估器在生产流量上自动运行,可以针对所有运行记录,也可以针对采样的子集。这些评估器可以检查:
- Reference-free quality metrics: Attributes like coherence and tone that don't require a ground truth answer无需参考的质量指标:连贯性和语气等不需要标准答案的属性
- Safety and compliance: Whether responses contain sensitive information, violate policies, or exhibit harmful behavior安全与合规:响应是否包含敏感信息、违反政策或表现出有害行为
- Format validation: Whether outputs follow expected structures or contain required elements格式验证:输出是否遵循预期结构或包含所需元素
- Topic classification: What categories of requests users are making主题分类:用户正在进行什么类别的请求
LLMs can assess natural language at a scale beyond human review. While humans might review dozens of traces, an LLM evaluator can assess thousands, flagging potential issues and providing aggregate metrics.大语言模型可以评估超出人类审查规模的自然语言。虽然人类可能审查几十条轨迹,但大语言模型评估器可以评估数千条,标记潜在问题并提供汇总指标。
However, LLM-based evaluations also introduce their own costs and constraints:然而,基于大语言模型的评估也引入了它们自己的成本和约束:
- Latency: Evaluators can add a few seconds of latency per trace, which may be acceptable for async batch evaluation but not for synchronous user feedback延迟:评估器每条轨迹可能会增加几秒钟的延迟,这对于异步批量评估可能是可以接受的,但对于同步用户反馈则不然
- Cost: Evaluating all traces can add to your inference costs, which is why we typically recommend sampling 10-20% of traffic成本:评估所有轨迹会增加推理成本,这就是为什么我们通常建议采样 10-20% 的流量
- Accuracy: Off-the-shelf evaluators may not reflect what "good" means for your specific app. Custom LLM-as-judge evaluators aligned to your use case are often necessary, but ensuring they agree with human judgment can also be difficult. We built Align Evals to help teams validate their custom evaluators are calibrated against human labels before you trust them at scale.准确性:现成的评估器可能无法反映你的特定应用中“好”的定义。通常需要针对你的用例进行调整的自定义“大语言模型作为裁判”(LLM-as-judge)评估器,但确保它们与人类判断一致也可能很困难。我们构建了 Align Evals 来帮助团队在进行大规模信任之前,验证其自定义评估器是否已根据人类标签进行了校准。
- Evaluation drift: As production traffic shifts, evaluators may need retuning or replacement评估漂移:随着生产流量的变化,评估器可能需要重新调整或更换
For these reasons, we recommend combining automated evaluation with periodic human review rather than relying solely on LLM evaluators.由于这些原因,我们建议将自动化评估与定期人工审查相结合,而不是仅仅依赖大语言模型评估器。
Tools for production agent observability用于生产环境智能体可观测性的工具
Building effective production observability for agents requires a specific set of capabilities, most of which general-purpose monitoring tools weren't designed to provide. Based on patterns we observed across dozens of production deployments, we built the following into LangSmith.构建有效的生产环境智能体可观测性需要一套特定的能力,其中大多数是通用监控工具未被设计提供的。基于我们在数十个生产部署中观察到的模式,我们将以下功能构建到了 LangSmith 中。
Insights Agent: Discovering usage and error patternsInsights Agent:发现使用和错误模式
One of the more challenging aspects in production is simply understanding what users are doing with your agent.生产环境中最具挑战性的方面之一,仅仅是了解用户正在用你的智能体做什么。
When we analyzed how teams were using production traces, we found they needed a way to automatically discover patterns without specifying what to look for upfront. This motivated us to build Insights Agent, which uses an automated clustering system that groups similar traces to identify:当我们分析团队如何使用生产轨迹时,我们发现他们需要一种无需预先指定查找内容即可自动发现模式的方法。这促使我们构建了 Insights Agent,它使用自动聚类系统将相似的轨迹分组,以识别:
- Usage patterns: What are the most common types of requests users make? Which features or capabilities are they trying to use?使用模式:用户最常见的请求类型是什么?他们试图使用哪些功能或能力?
- Error modes: Where is the agent making mistakes? Are there common failure patterns like incorrect tool selection, retrieval failures, or misunderstanding user intent?错误模式:智能体在哪里犯错?是否存在常见的失败模式,如工具选择不当、检索失败或误解用户意图?
- Edge cases: What unexpected queries are users sending that you didn't account for?边缘情况:用户正在发送哪些你未考虑到的意外查询?

Insights Agent can be configured to group traces by usage patterns, failure modes, or custom attributes specific to your domain. You can also filter the analysis to specific subsets (time windows, user cohorts, feature areas) and save configurations for repeated analysis.Insights Agent 可以配置为按使用模式、失败模式或特定于你领域的自定义属性对轨迹进行分组。你还可以将分析过滤到特定的子集(时间窗口、用户群组、功能区域),并保存配置以进行重复分析。
For example, a product manager at a company with an embedded copilot might ask: "What parts of our product are users trying to use the copilot for most often?" Insights Agent can analyze thousands of traces, group them by intent, and surface the top usage categories.例如,一家拥有嵌入式 Copilot 的公司的产品经理可能会问:“用户最常尝试使用 Copilot 来处理我们产品的哪些部分?” Insights Agent 可以分析数千条轨迹,按意图对它们进行分组,并呈现出最主要的使用类别。
An engineer debugging quality issues might ask: "Where is my agent selecting the wrong tools?" Insights Agent can identify common patterns in tool selection failures and provide representative examples.一名调试质量问题的工程师可能会问:“我的智能体在哪里选择了错误的工具?” Insights Agent 可以识别工具选择失败中的常见模式,并提供代表性示例。
This automated pattern discovery helps make the volume of production traces more manageable and actionable.这种自动化的模式发现有助于使大量的生产轨迹变得更易于管理和采取行动。
Online Evaluations: Continuous quality monitoring在线评估:持续的质量监控
We mentioned online evaluations earlier as a way to scale human judgment. Let's look at how they work in practice.我们之前提到了在线评估作为扩展人类判断的一种方式。让我们看看它们在实践中是如何工作的。
With online evaluations, you set up evaluators that run automatically on production traces. You can configure:通过在线评估,你可以设置在生产轨迹上自动运行的评估器。你可以配置:
- Which traces to evaluate: All traces, sampled percentages (typically 10-20%), or specific filtered subsets要评估哪些轨迹:所有轨迹、采样百分比(通常为 10-20%)或特定的过滤子集
- What to evaluate: Quality metrics, safety checks, format validation, or custom criteria要评估什么:质量指标、安全检查、格式验证或自定义标准
- When to alert: Thresholds that trigger notifications when metrics degrade何时发出警报:当指标下降时触发通知的阈值
Online evaluations serve several purposes beyond traditional "testing":在线评估除了传统的“测试”之外,还有多种用途:
- Quality monitoring: You can track how often the agent produces helpful, relevant, correct responses over time. This allows you to detect when quality degrades due to model updates, data drift, or new user patterns.质量监控:你可以跟踪智能体产生有帮助、相关、正确响应的频率。这使你能够检测到由于模型更新、数据漂移或新用户模式导致的质量下降。
- Topic tagging: You can automatically classify production queries into categories for product analytics. This gives you visibility into what users are actually trying to accomplish.主题标记:你可以自动将生产查询分类为类别以进行产品分析。这让你能够了解用户实际上试图完成什么。
- Trajectory evaluation: For agents that use multiple tools or reasoning steps, you can evaluate whether the agent took an appropriate path to the answer. Did it call the right tools in a sensible order? Did it retrieve relevant information?轨迹评估:对于使用多个工具或推理步骤的智能体,你可以评估智能体是否采取了适当的路径来获得答案。它是否以合理的顺序调用了正确的工具?它是否检索到了相关信息?
- Security and safety: You can check for sensitive information in outputs, policy violations, or other safety concerns in real time.安全与保障:你可以实时检查输出中的敏感信息、政策违规或其他安全问题。

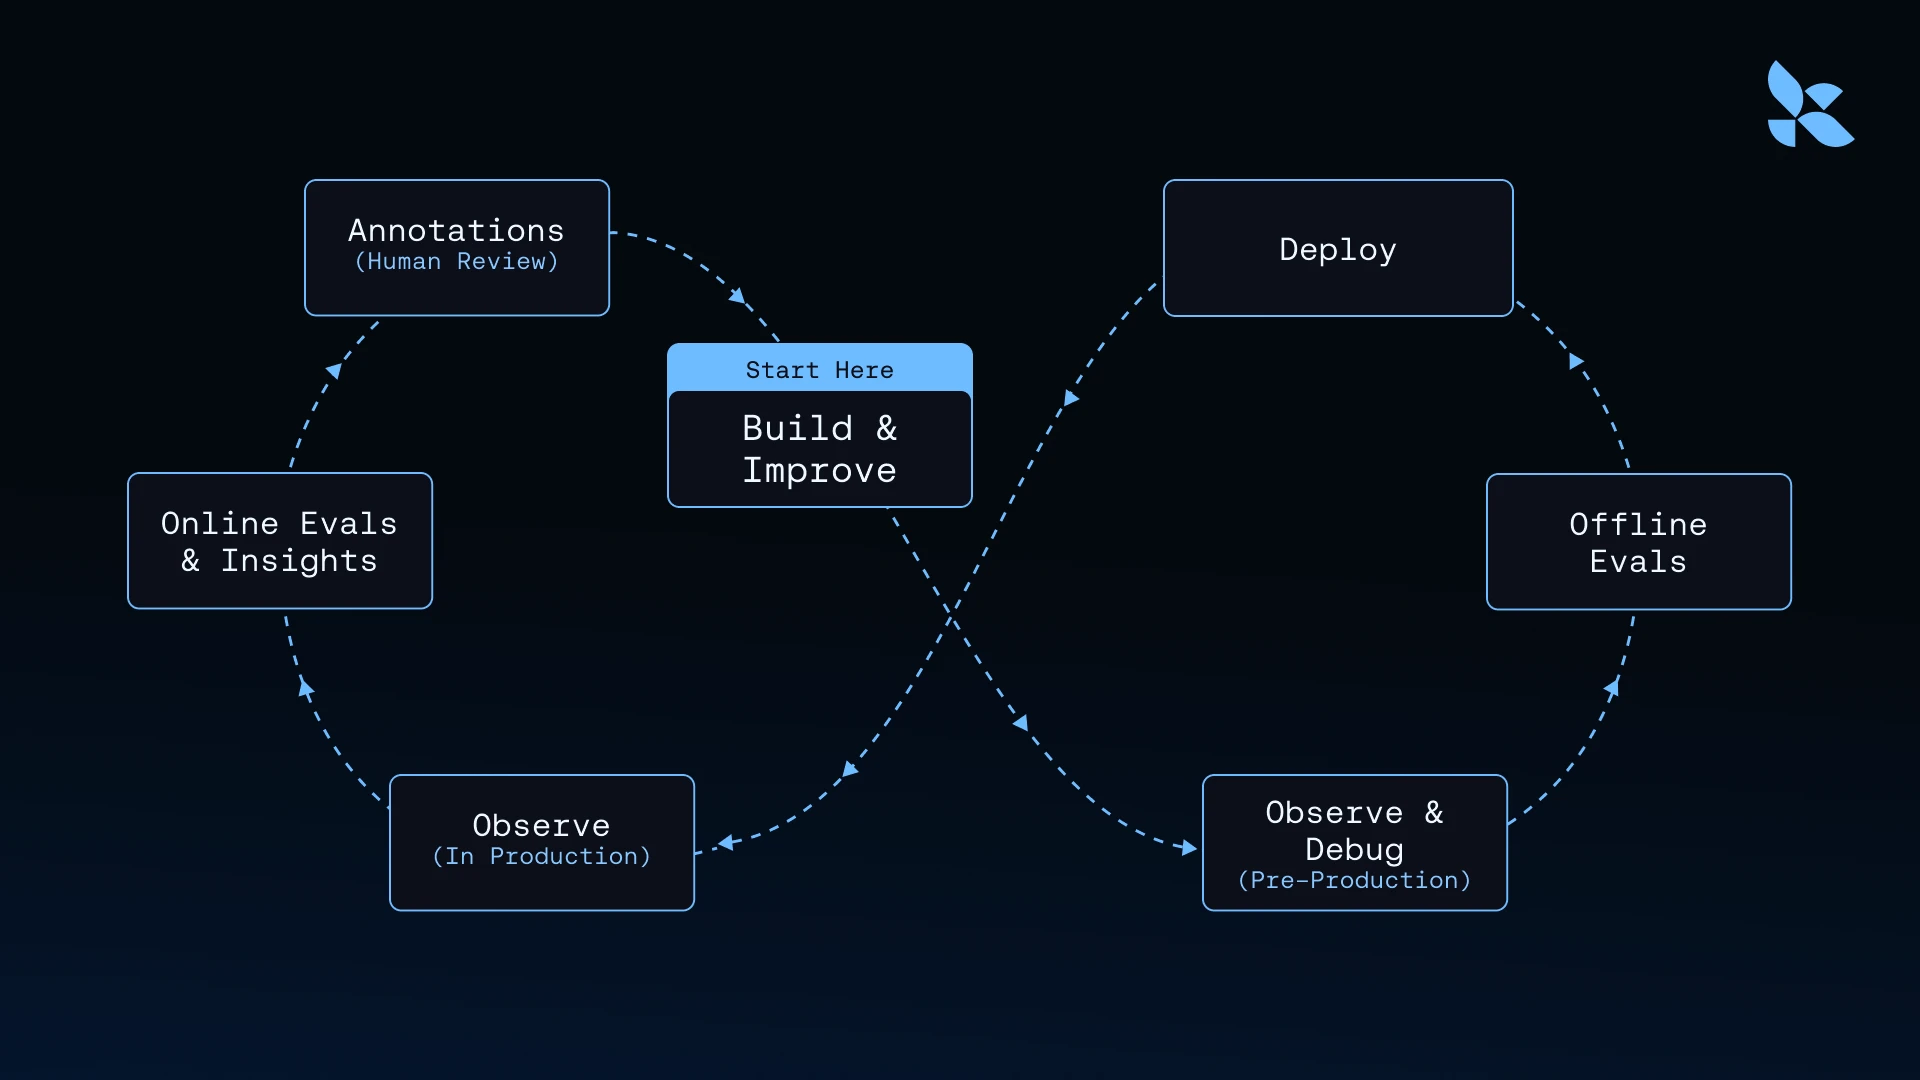
The ability to run evaluations continuously on production traffic enables a development workflow where you can drill into specific failing traces, add them to annotation queues for human review, incorporate them into evaluation datasets, and test fixes before redeploying.在生产流量上持续运行评估的能力,实现了一种开发工作流,你可以深入研究特定的失败轨迹,将它们添加到标注队列中进行人工审查,将它们纳入评估数据集,并在重新部署之前测试修复方案。
Dashboards and alerts: Monitoring what matters仪表板和警报:监控重要事项
Finally, production observability requires dashboards and alerting on metrics that matter to your specific use case. Effective observability platforms provide:最后,生产环境可观测性需要针对你特定用例的指标进行仪表板展示和警报。有效的可观测性平台提供:
- Custom dashboards for domain-specific insights, allowing you to track success metrics (such as task completion rates or user satisfaction scores) for different workflows. You can also compare performance across model versions and monitor cost and latency by feature area用于领域特定洞察的自定义仪表板,允许你跟踪不同工作流的成功指标(如任务完成率或用户满意度分数)。你还可以比较不同模型版本的性能,并按功能区域监控成本和延迟
- Flexible alerting via webhooks or PagerDuty when metrics cross thresholds当指标超过阈值时,通过 Webhooks 或 PagerDuty 进行灵活警报
- Drill-down capabilities from aggregate metrics into specific traces从汇总指标深入到特定轨迹的钻取能力

Production observability requires tracking metrics specific to how agents actually behave. Beyond standard latency and error rates, this means monitoring metrics like tool call failure rates and run count by tool. These signals tell you whether the agent is actually working as intended, not just whether the system is running.生产环境可观测性需要跟踪特定于智能体实际行为的指标。除了标准的延迟和错误率之外,这意味着要监控工具调用失败率和按工具划分的运行次数等指标。这些信号告诉你智能体是否真的按预期工作,而不仅仅是系统是否在运行。
The key is monitoring business-critical metrics, not just technical ones. Yes, you care about latency and error rates. But you also care about metrics like user satisfaction, and whether the agent is being used for the intended purposes.关键在于监控业务关键指标,而不仅仅是技术指标。是的,你关心延迟和错误率。但你也关心用户满意度等指标,以及智能体是否被用于预期的目的。
Why general-purpose tools fall short为什么通用工具力不从心
At this point, you might wonder: couldn't I build this with traditional observability tools like Datadog or New Relic? Why do I need a specialized platform?此时,你可能会问:我不能用 Datadog 或 New Relic 等传统可观测性工具来构建这个吗?为什么我需要一个专门的平台?
Many teams initially attempt to monitor agents using traditional APM tools. We've found this works for basic metrics (latency, error rates) but encounters limitations with agent-specific requirements. The gaps emerge in three areas: payloads, connectivity, and users.许多团队最初尝试使用传统 APM 工具来监控智能体。我们发现这对于基本指标(延迟、错误率)有效,但在智能体特定需求方面遇到了局限性。差距出现在三个领域:负载、连接性和用户。
Payloads: Natural language data负载:自然语言数据
Traditional APM tools are optimized for structured logs and numeric metrics. When you need to store, search, and analyze full conversation threads with multi-turn context, you encounter different requirements:传统 APM 工具针对结构化日志和数值指标进行了优化。当你需要存储、搜索和分析具有多轮上下文的完整对话线程时,你会遇到不同的需求:
- Storage scale: Full prompt-response pairs at production scale require significant storage. You need semantic search capabilities over prompts, not just keyword matching. And you need to preserve full context including system messages and few-shot examples.存储规模:生产规模下的完整提示-响应对需要大量的存储空间。你需要对提示词进行语义搜索能力,而不仅仅是关键词匹配。并且你需要保留包括系统消息和少样本示例在内的完整上下文。
- Data models: Maintaining conversation threads and state require different data structures than traditional traces.数据模型:维护对话线程和状态需要与传统轨迹不同的数据结构。
We've seen teams build this on top of APM tools, but it requires significant custom development.我们见过团队在 APM 工具之上构建此功能,但这需要大量的自定义开发。
Connectivity: Integration with the development loop连接性:与开发循环的集成
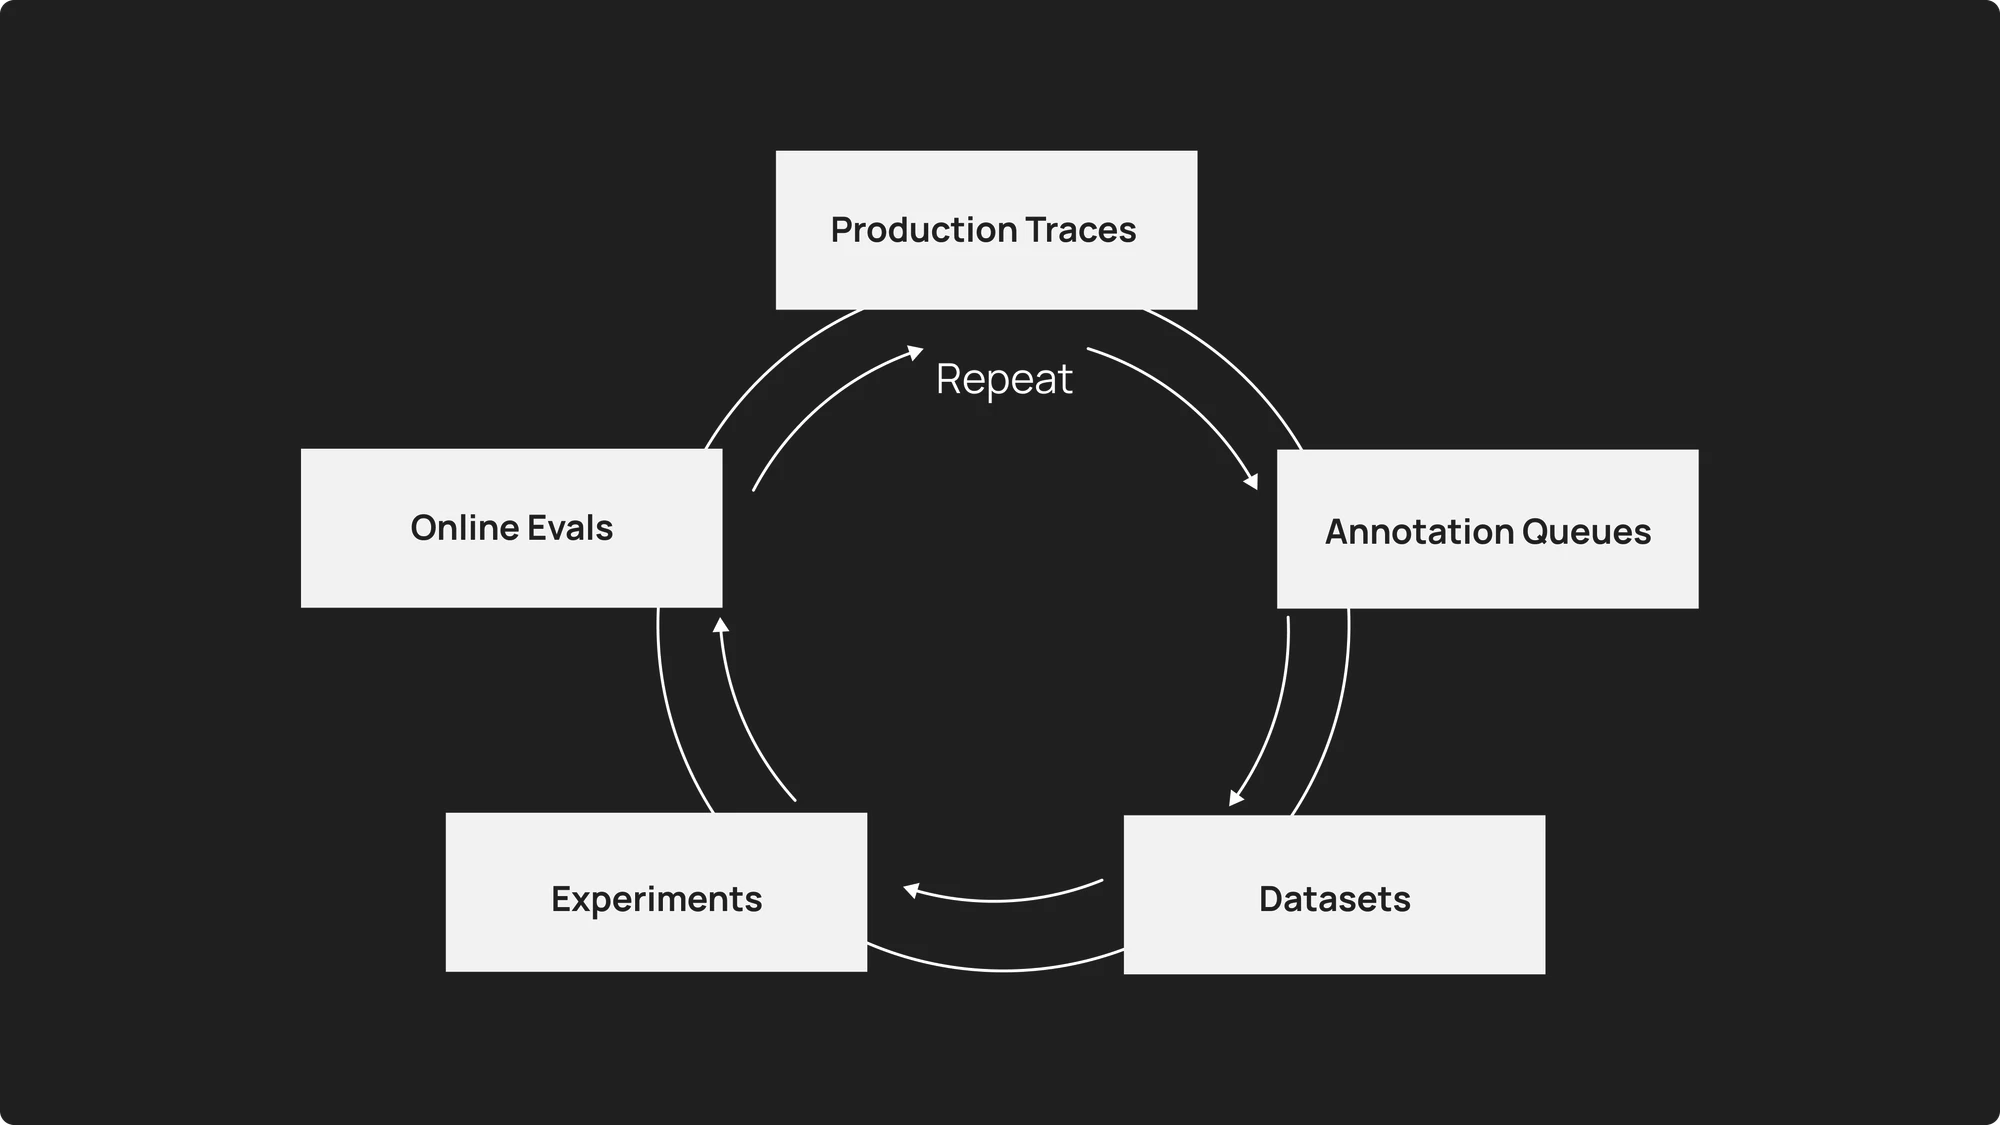
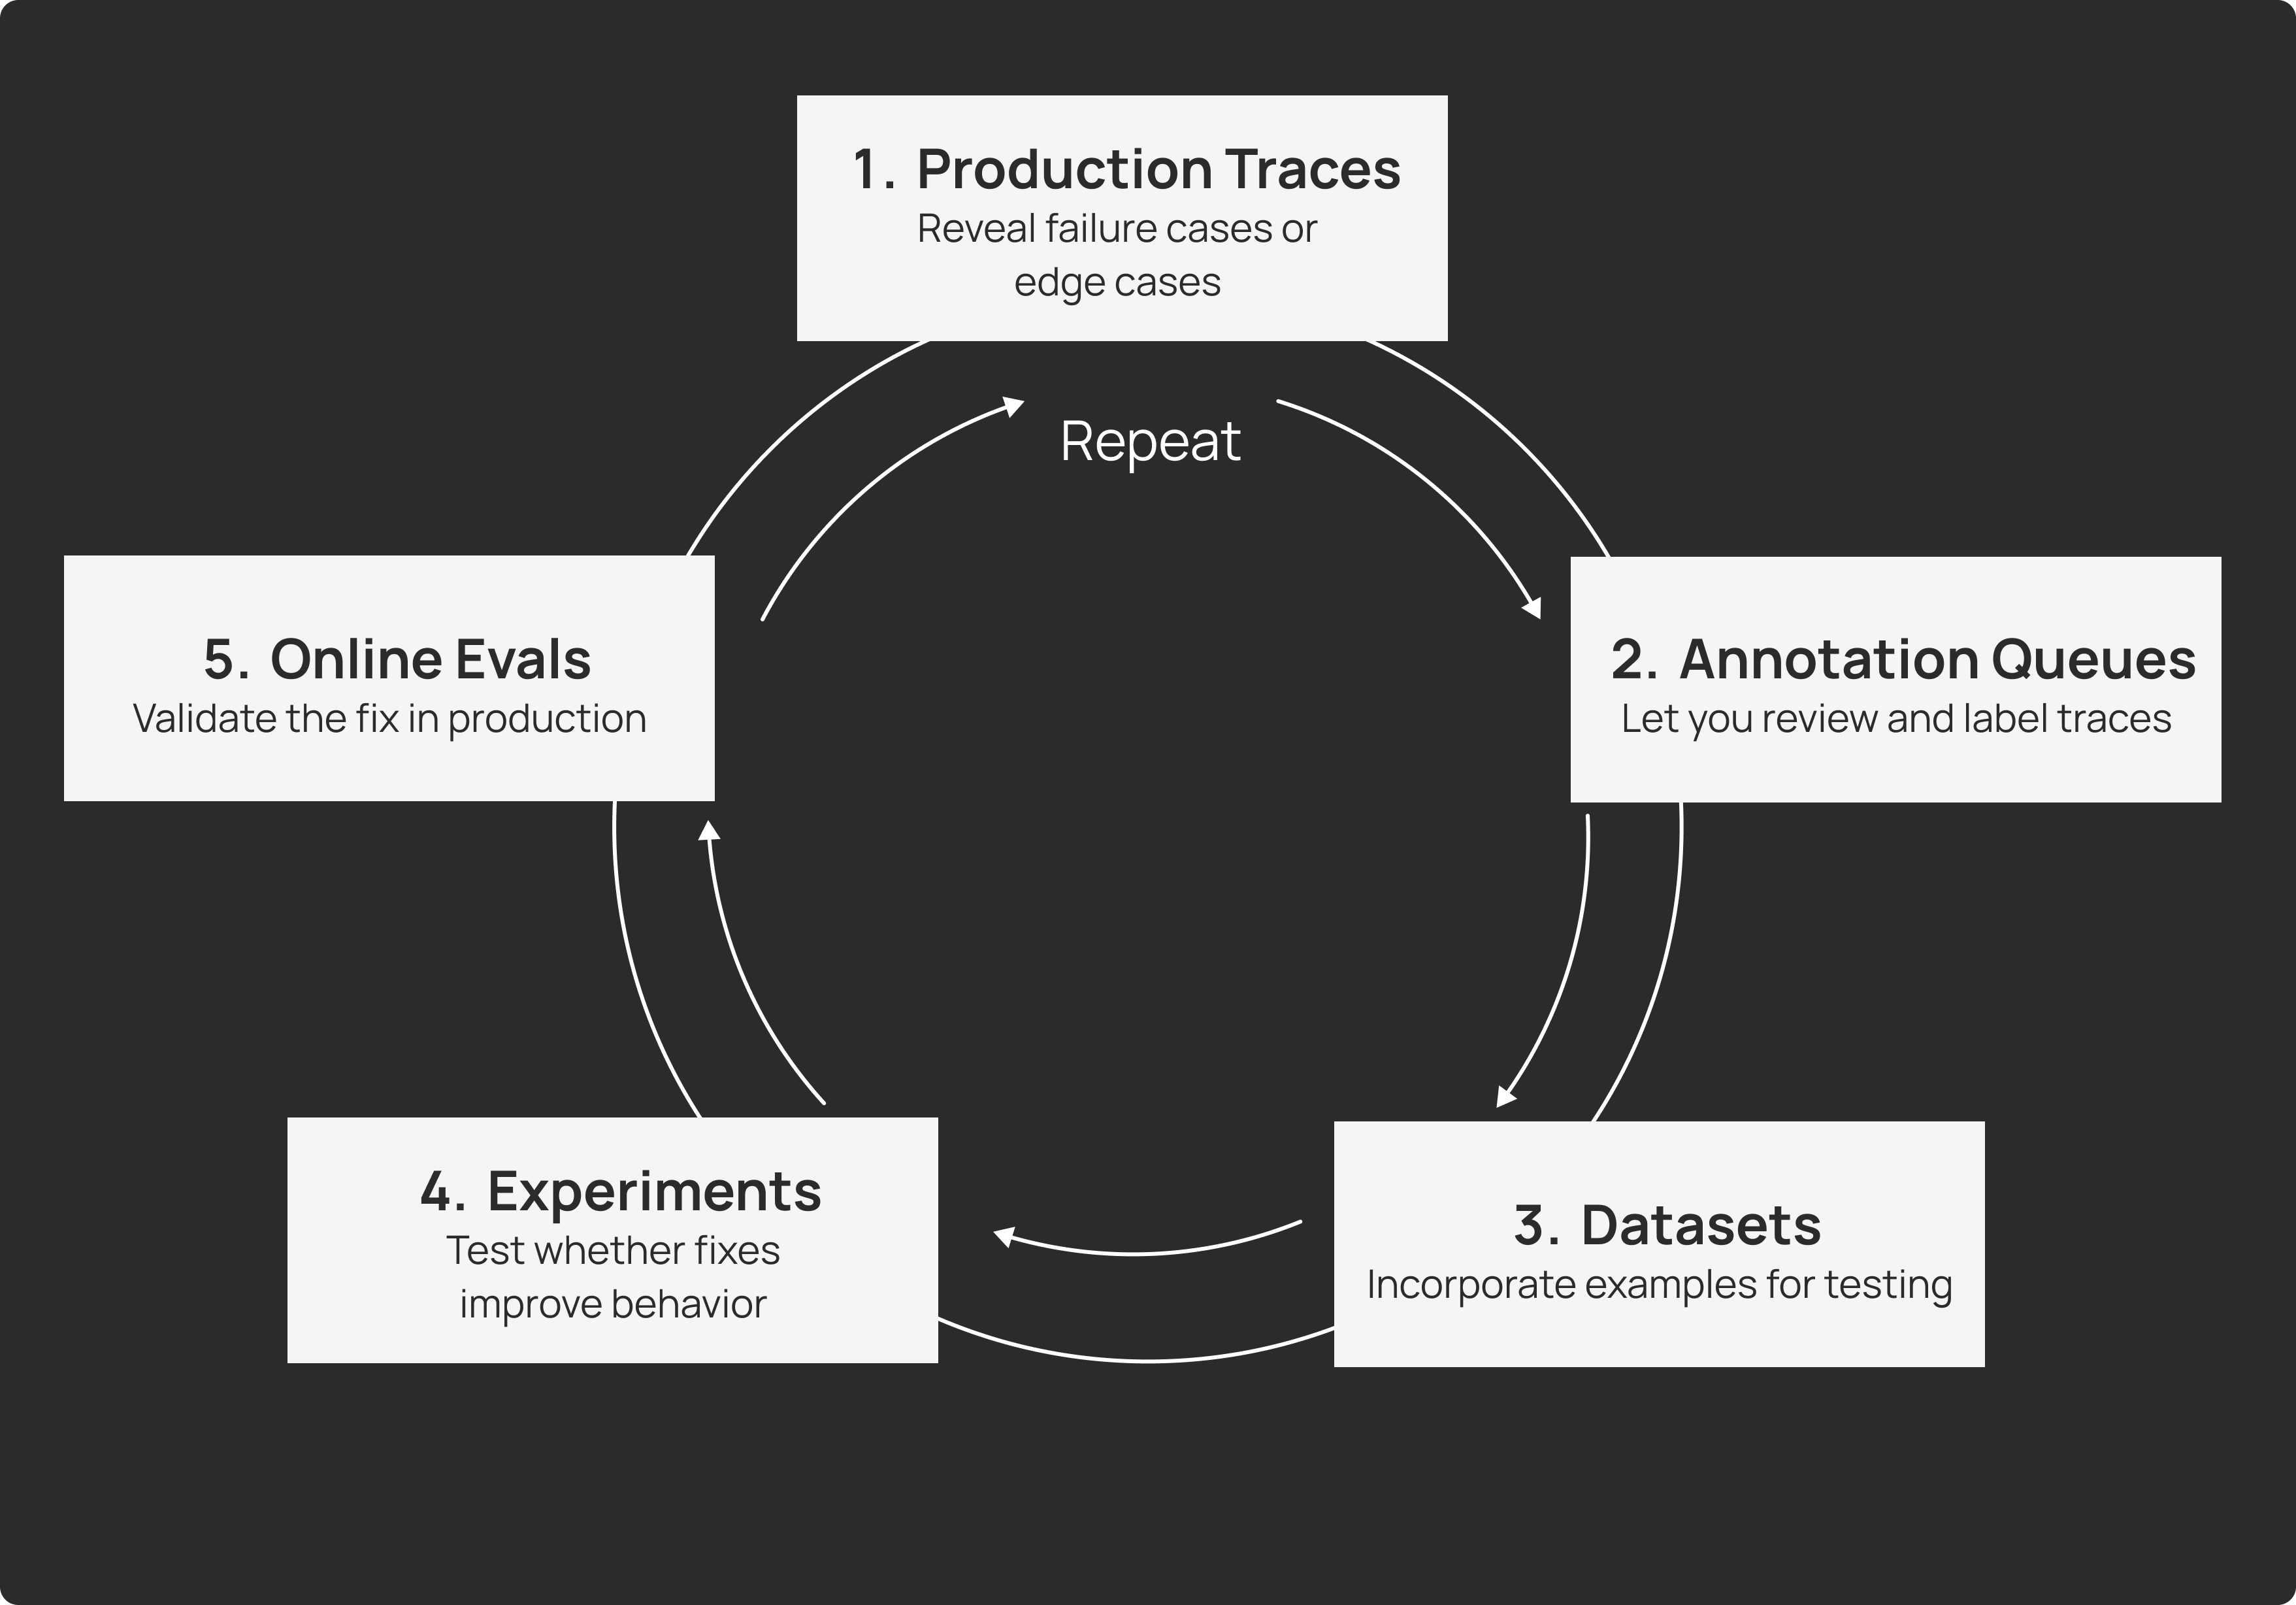
Agent observability is deeply connected to the agent development workflow, where you should be continuously moving data between production monitoring, evaluation datasets, experimentation, and redeployment. The loop looks like:智能体可观测性与智能体开发工作流深度连接,你应该在生产监控、评估数据集、实验和重新部署之间持续移动数据。这个循环看起来像:
- Production traces reveal failure cases or edge cases生产轨迹揭示失败案例或边缘情况
- Annotation queues let you review and label them标注队列让你审查并标记它们
- Datasets incorporate these examples for testing数据集将这些示例纳入测试
- Experiments test whether fixes improve behavior实验测试修复方案是否改善了行为
- Online evaluations validate the fix in production在线评估验证生产环境中的修复
This requires tight integration between your observability platform, your evaluation framework, and your development tools. Unlike traditional observability tools, LangSmith provides this connectivity. You can click a failing production trace and immediately add it to a dataset, modify your prompt in a playground environment, run an experiment comparing the old and new versions, and redeploy with confidence.这需要你的可观测性平台、评估框架和开发工具之间的紧密集成。与传统可观测性工具不同,LangSmith 提供了这种连接性。你可以点击一条失败的生产轨迹并立即将其添加到数据集中,在 Playground 环境中修改你的提示词,运行一个比较旧版本和新版本的实验,并充满信心地重新部署。
Users: Cross-functional teams用户:跨职能团队
Finally, the people who need access to agent observability are different from those who typically use APM tools. Traditional observability is primarily for SRE and DevOps teams, who are focused on improving system health, performance regressions, and infrastructure issues.最后,需要访问智能体可观测性的人员与通常使用 APM 工具的人员不同。传统可观测性主要针对 SRE 和 DevOps 团队,他们专注于改善系统健康状况、性能回归和基础设施问题。
Agent observability is for cross-functional teams, including:智能体可观测性适用于跨职能团队,包括:
- AI/ML engineers debugging prompt issues and model behavior调试提示词问题和模型行为的 AI/ML 工程师
- Product managers understanding usage patterns and feature requests了解使用模式和功能需求的产品经理
- Subject matter experts (SMEs) reviewing accuracy and quality in specialized areas在专业领域审查准确性和质量的主题专家 (SMEs)
- Data scientists analyzing patterns and building evaluations分析模式和构建评估的数据科学家
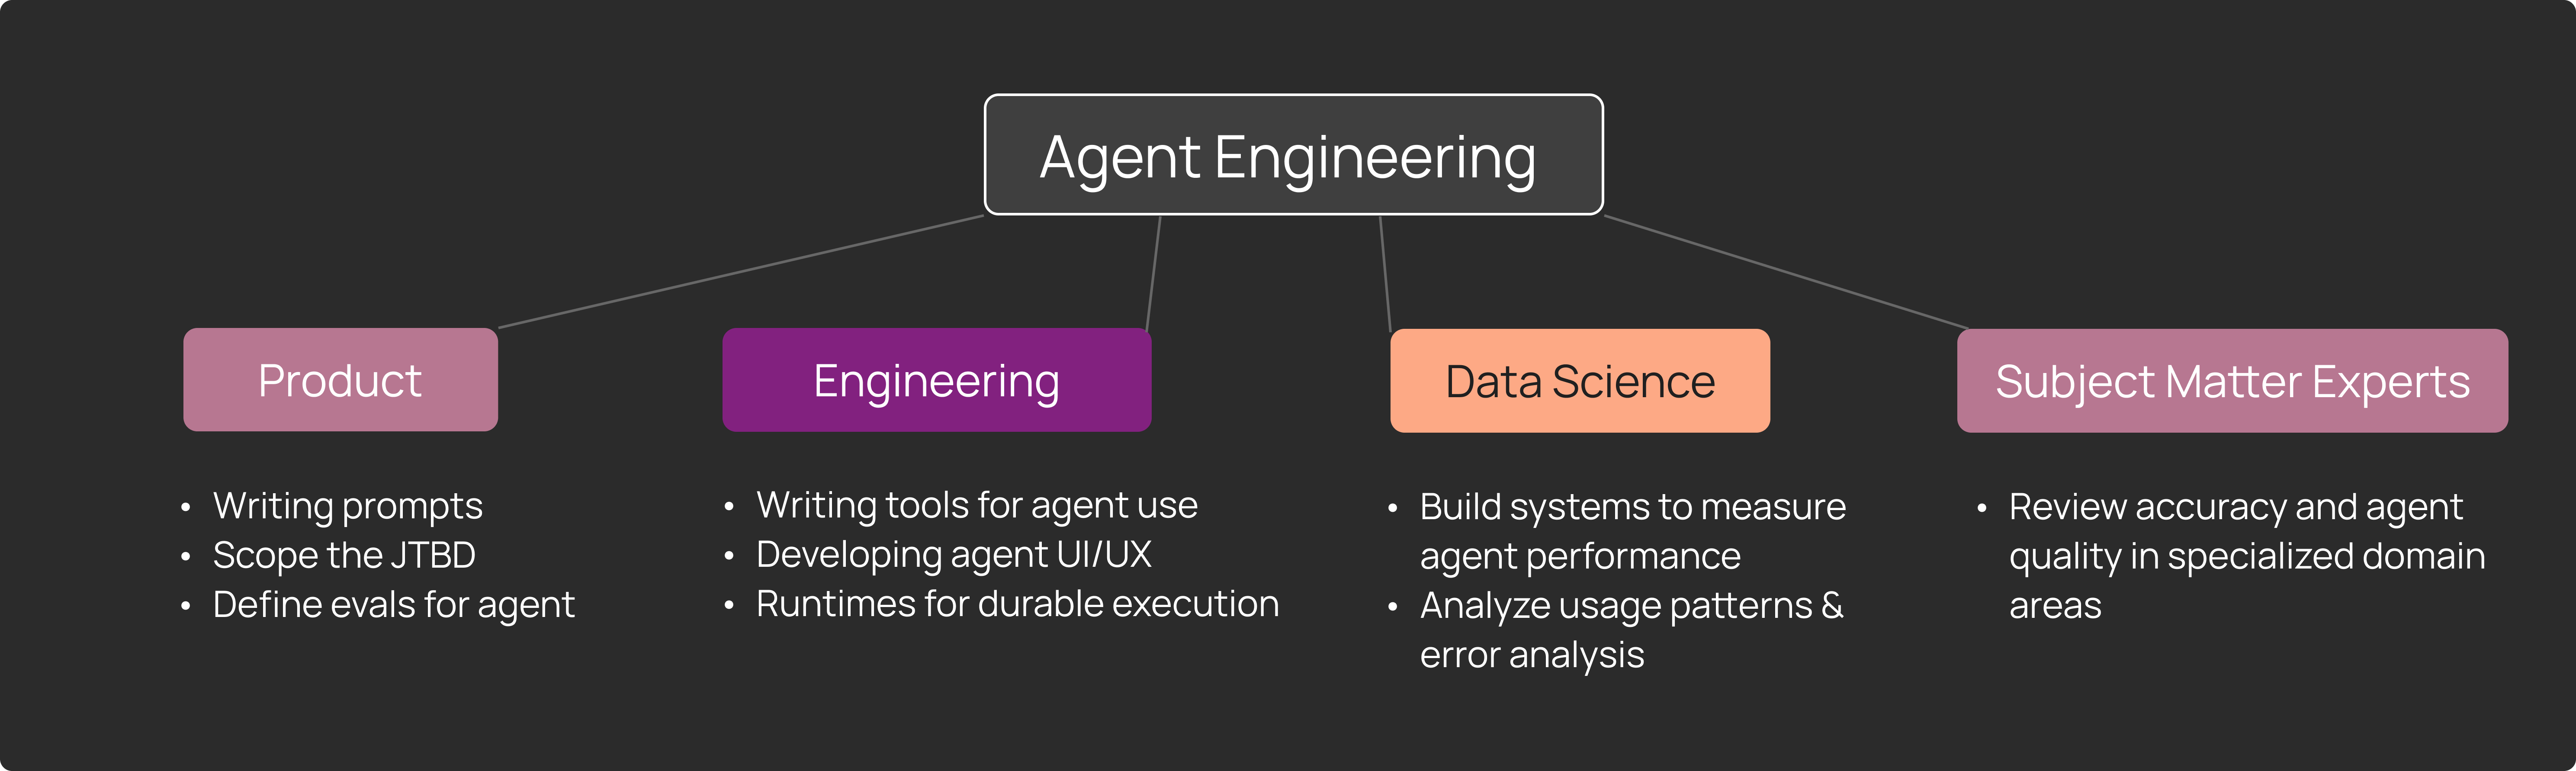
We've observed that agent observability becomes central to how these teams work together to improve the user experience. They regularly do data reviews of production traces, discuss patterns, and make decisions about priorities based on what they observe.我们观察到,智能体可观测性成为这些团队如何共同努力改善用户体验的核心。他们定期对生产轨迹进行数据审查,讨论模式,并根据观察到的情况就优先级做出决策。
This requires an interface and workflow designed for collaboration across these personas, not just for infrastructure engineers.这需要一个专为这些角色之间的协作而设计,而不仅仅是为基础设施工程师设计的界面和工作流。
Open challenges开放挑战
While the approaches we've described have proven effective for teams deploying agents at scale, significant challenges remain:虽然我们描述的方法已被证明对大规模部署智能体的团队有效,但仍存在重大挑战:
- Evaluator accuracy and reliability: LLM evaluators continue to improve as models get better, but they aren’t perfect. Understanding when to trust automated evaluation versus requiring human review remains context-dependent.评估器的准确性和可靠性:随着模型的改进,大语言模型评估器在不断进步,但它们并不完美。了解何时信任自动化评估与何时需要人工审查仍然取决于具体上下文。
- Cost at scale: Comprehensive monitoring of high-volume production systems can be expensive. Finding the right balance of sampling, automated evaluation, and human review is an ongoing optimization.大规模成本:对高容量生产系统进行全面监控可能很昂贵。找到采样、自动化评估和人工审查之间的正确平衡是一个持续的优化过程。
- Privacy and compliance: Capturing full prompt-response pairs while respecting privacy constraints and handling sensitive data appropriately adds complexity to observability infrastructure.隐私与合规:在尊重隐私约束并适当处理敏感数据的同时捕获完整的提示-响应对,增加了可观测性基础设施的复杂性。
Conclusion结论
Agents operate differently from traditional software. They accept natural language inputs, exhibit non-deterministic behavior, and make decisions through complex reasoning chains. These characteristics shift the focus of production monitoring from system metrics to the actual inputs and outputs themselves.智能体的运作方式与传统软件不同。它们接受自然语言输入,表现出非确定性行为,并通过复杂的推理链做出决策。这些特征将生产监控的重点从系统指标转移到了实际的输入和输出本身。
The approaches we've described (structured annotation queues, automated pattern discovery, and continuous evaluation) represent our current thinking on how to make production agent behavior observable and improvable at scale. We built LangSmith to address these requirements based on patterns we observed working with teams deploying agents.我们描述的方法(结构化标注队列、自动化模式发现和持续评估)代表了我们目前关于如何使生产环境中的智能体行为在大规模下可观测且可改进的思考。我们构建 LangSmith 是为了基于我们在与部署智能体的团队合作中观察到的模式来满足这些需求。
If you're working on agent observability, we'd be interested to hear what approaches you've found effective. Learn more about LangSmith Observability or read our documentation.如果你正在研究智能体可观测性,我们很想听听你发现哪些方法有效。了解更多关于 LangSmith Observability 的信息或阅读我们的文档。
Additional Reading延伸阅读
Learn how:了解如何:
- Monday uses online evaluations to monitor their customer-facing agentsMonday 使用在线评估来监控其面向客户的智能体
- Appfolio leverages LangSmith to monitor and pinpoint issues in productionAppfolio 利用 LangSmith 监控并查明生产环境中的问题
- Podium collects user feedback and performs online evals to improve response qualityPodium 收集用户反馈并执行在线评估以提高响应质量
- Jimdo monitors agent metrics including quality scores and tool quality outputJimdo 监控智能体指标,包括质量分数和工具质量输出