
- DateMarch 12, 2026
- Reading time5min
- ShareCopy link
Update: Now available in Claude Cowork on all paid plans (April 22, 2026).
Last fall, we previewed Imagine with Claude: a new way for Claude to build visuals in real time, without any code. We’re now bringing a version of this feature, in beta, to Claude’s chat conversations. Claude can create custom charts, diagrams and other visualizations in-line in its responses—and then tweak and modify its creations as the conversation develops. 更新:现已在所有付费计划的Claude Cowork中可用(2026年4月22日)。去年秋天,我们预览了Imagine with Claude:一种让Claude实时构建视觉内容的新方式,无需任何代码。现在,我们将此功能的测试版引入Claude的聊天对话中。Claude可以在其回复中直接创建自定义图表、图示和其他可视化内容,并在对话发展过程中进行调整和修改。
Claude’s conversations already include artifacts: permanent tools and documents created by Claude, designed to be shared or downloaded as more polished work. By contrast, these charts, diagrams and visualizations serve a different purpose: Claude builds them to aid users’ understanding as it’s discussing the topic at hand. They appear in-line, rather than in a side panel, and they’re temporary—they change or disappear as the conversation evolves.Claude的对话中已经包含工件:由Claude创建的永久性工具和文档,旨在作为更完善的作品分享或下载。相比之下,这些图表、图示和可视化内容服务于不同的目的:Claude在讨论当前主题时构建它们以帮助用户理解。它们出现在对话中,而非侧面板中,并且是临时的——随着对话的推进而变化或消失。
Here are a couple of examples. You can ask Claude how compound interest works, and it’ll give you a curve to play around with. Or you can ask about the periodic table, and it’ll build an interactive visualization in which you can click around for more details, as in the example below:以下是一些示例。你可以询问Claude复利如何运作,它会为你提供一个可操作的曲线图。或者你可以询问元素周期表,它会构建一个交互式可视化,你可以点击查看更多细节,如下例所示:
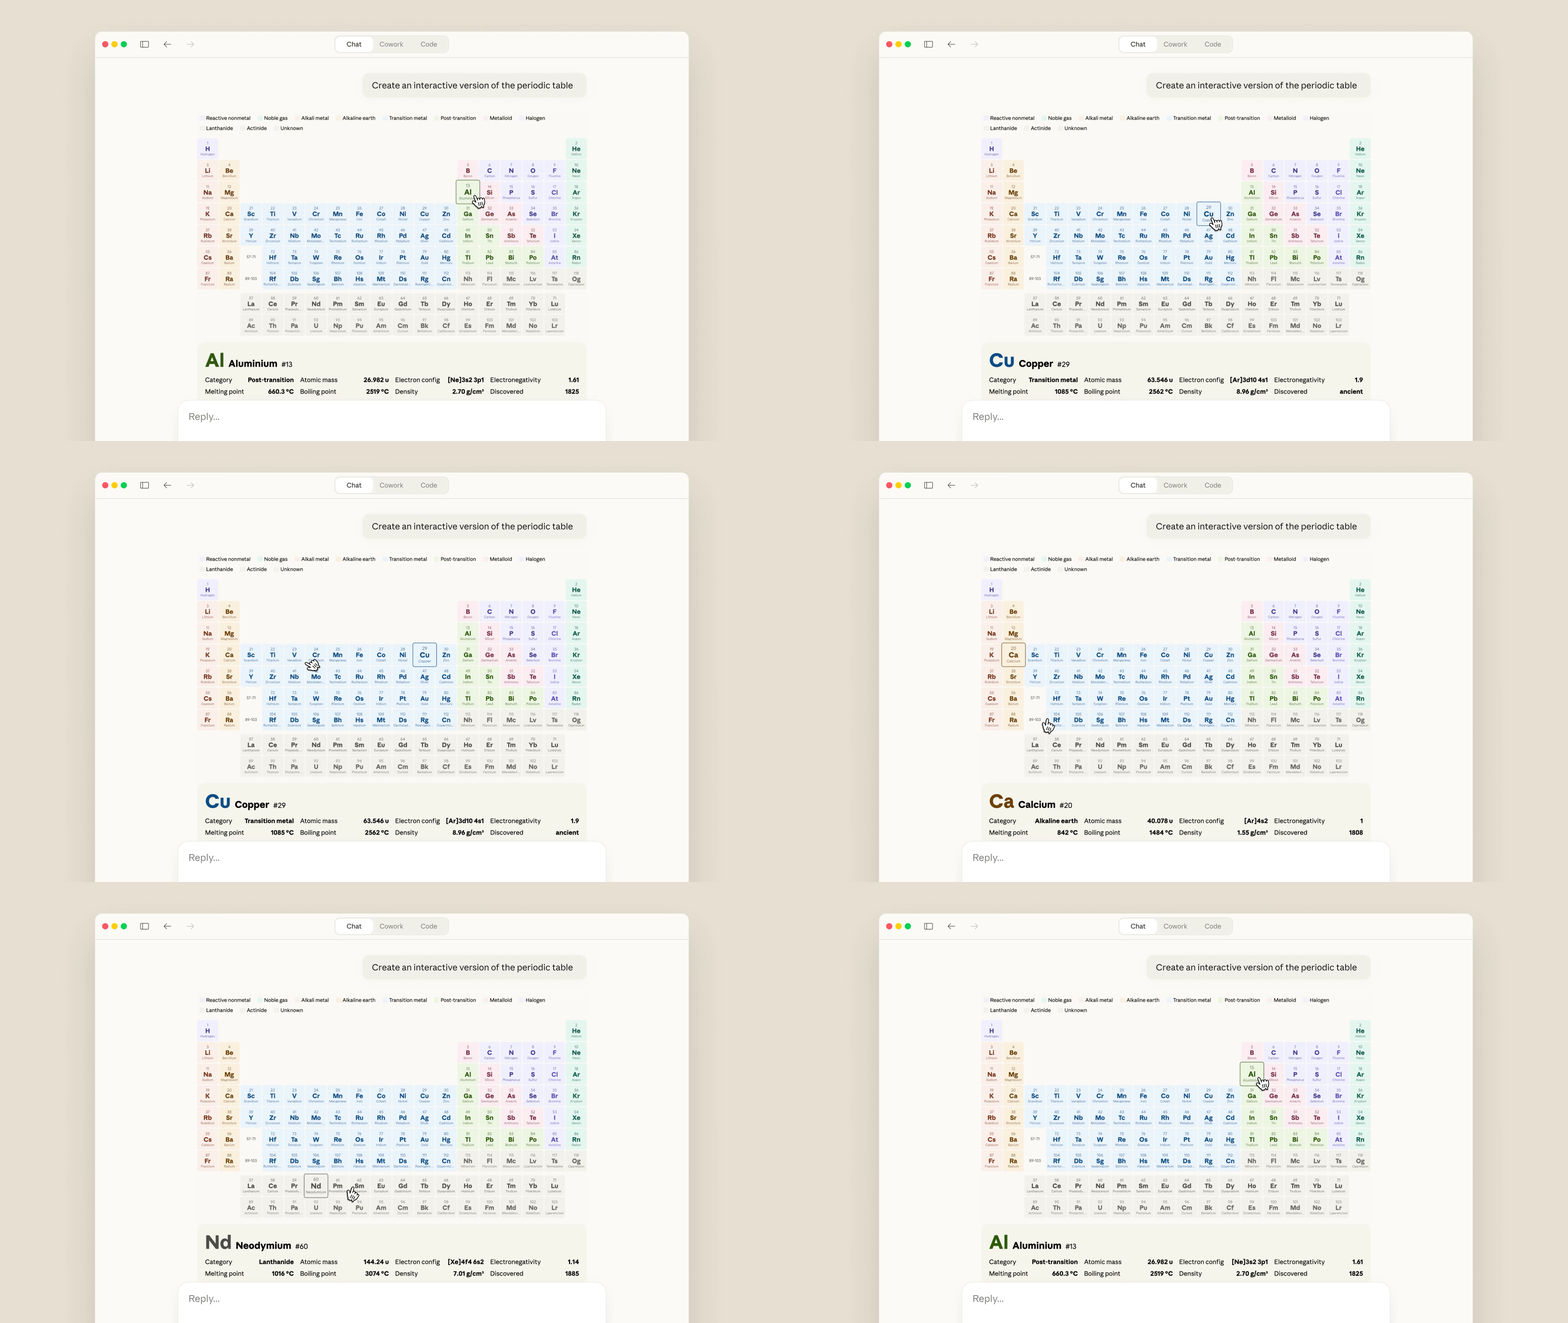
This feature will be on by default. Claude will decide when to build a visual for something, or you can ask it to do so directly (with a query like “draw this as a diagram” or “visualize how this might change over time”). Once Claude has created something, you can ask for adjustments or to dig in deeper. 此功能默认开启。Claude会自行决定何时为某些内容构建可视化,或者你也可以直接要求它这样做(例如通过“将其绘制成图表”或“可视化随时间的变化”等查询)。一旦Claude创建了内容,你可以要求进行调整或深入探讨。
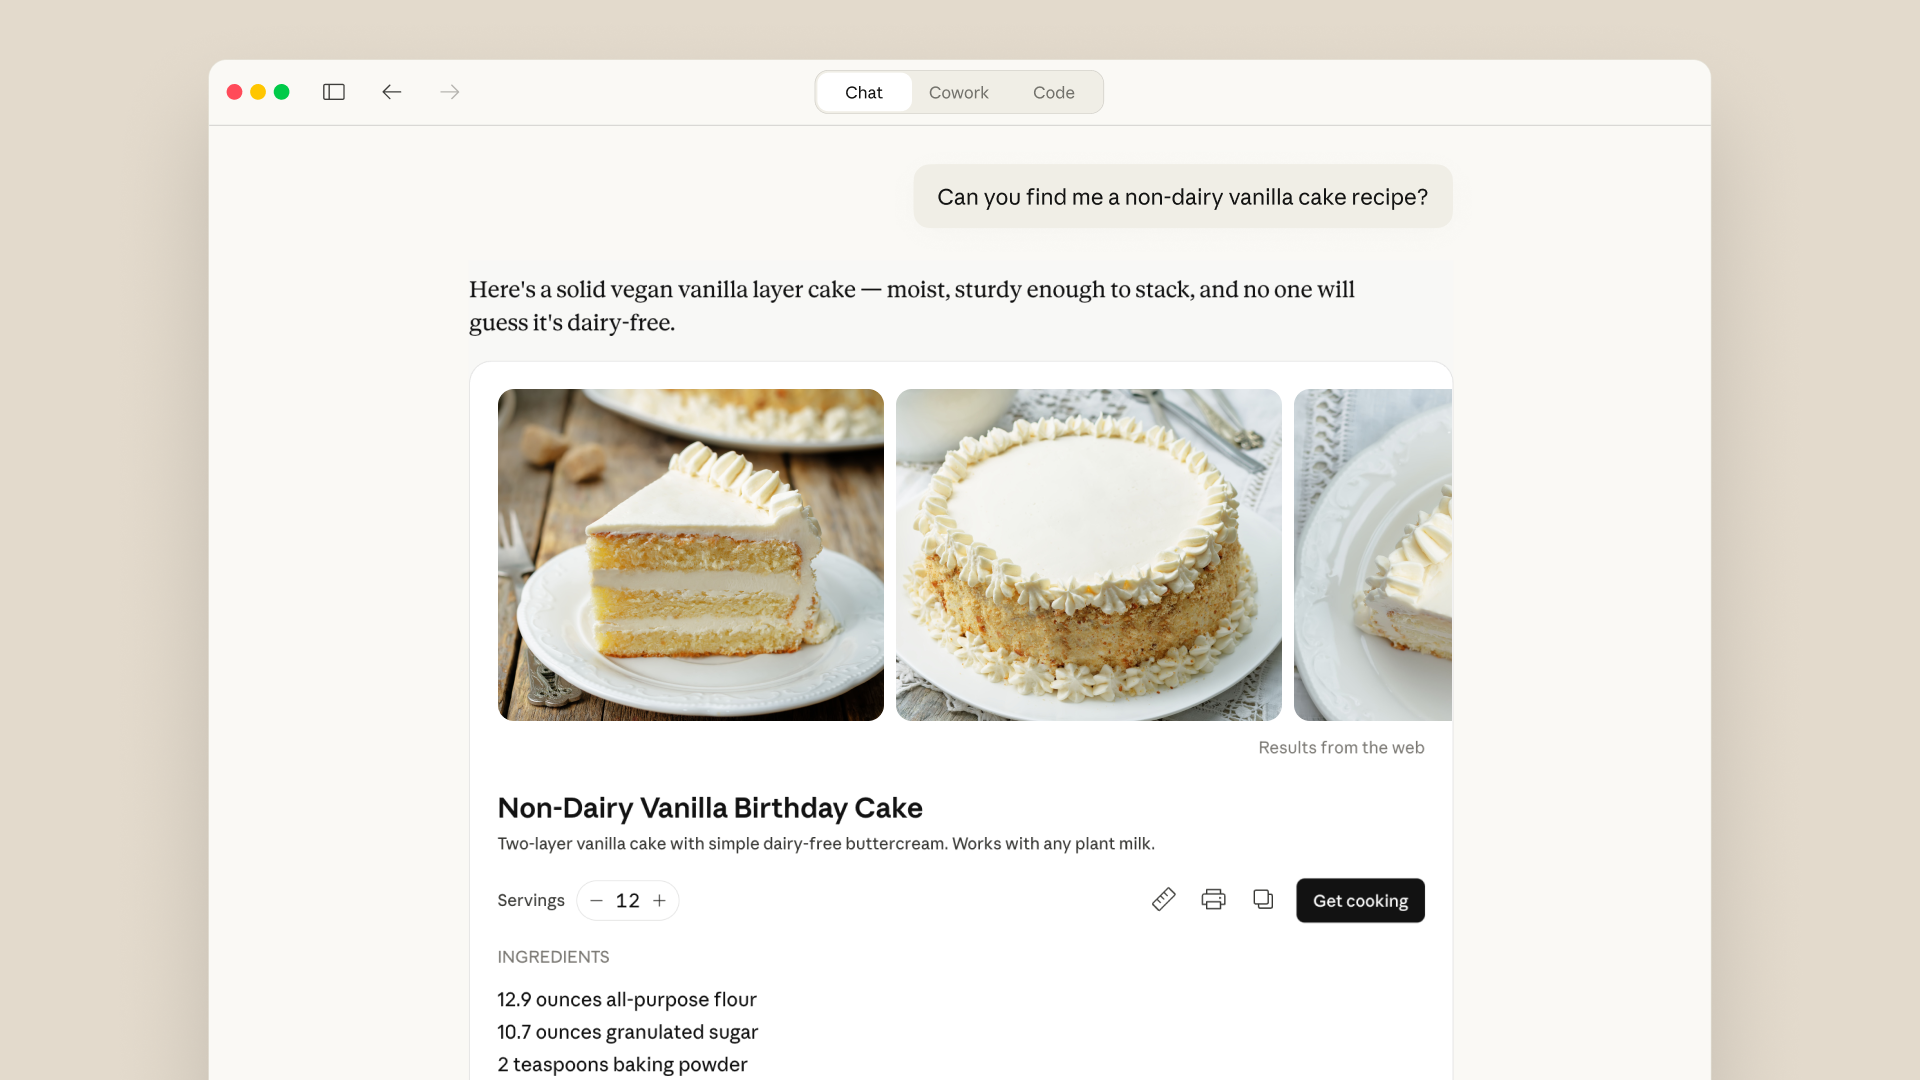
These visuals are part of a broader set of improvements we’ve made to Claude’s responses recently. Earlier this year, Claude began using purpose-designed formats for some topics: recipes, for example, now appear with ingredients and steps, and Claude provides a visual when you ask it for the weather. You can also interact directly with apps like Figma, Canva, and Slack within your discussions. 这些可视化是我们近期对Claude回复进行的一系列改进的一部分。今年早些时候,Claude开始针对某些主题使用专门设计的格式:例如,食谱现在会显示食材和步骤,当你询问天气时,Claude会提供可视化信息。你还可以在讨论中直接与Figma、Canva和Slack等应用进行交互。
Try it today. This feature is available on all plan types. 今天就试试吧。此功能在所有计划类型中均可用。



Transform how your organization operates with Claude
Get the developer newsletter
Product updates, how-tos, community spotlights, and more. Delivered monthly to your inbox.